
Two dispensary locations generate roughly twice the data of one. Ten dispensaries generate a flood of intel most operators never fully use, because the natural instinct is to review each store in isolation: pull up Location A's numbers, check them against last month, move on to Location B. That approach catches problems eventually, but it rarely catches them early – and it almost never reveals the patterns that only show up when stores are set side by side.
The case for centralized reporting for multi-location dispensaries isn't complicated. A location that's flat month over month looks fine on its own; the same location compared against three peers that are all up 8% tells a different story. A shrinkage rate of 2% sounds manageable in a vacuum; next to a sister store running 0.7%, it's a loss prevention problem worth a phone call.
Below are 15 specific cannabis retail KPIs that multi-store operators should be comparing across locations, organized into five categories: sales performance, inventory health, product mix and margin, staff and operations, and compliance and cash. For each one, you'll find what to measure, how it sharpens your dispensary performance decisions, and exactly which Cova report or dashboard provides the data – including the specific columns to look for.
As Randy Tingskou, a BC dispensary owner, put it: "Especially since we're running multiple locations, it's really nice to get my reports that I would normally have to manually search and generate emailed to me automatically."
By the end, you'll have a checklist of 15 cross-location metrics mapped to specific Cova reports and dashboards, ready to use the next time you're deciding where to reallocate inventory, adjust staffing, or dig into why one store is quietly underperforming.
Key Takeaways
- Multi-location cannabis retail operators get the most value from consolidated dispensary analytics that compare stores side by side, not from monitoring each location independently.
- Hub Reports can be scheduled for automatic email delivery with location-level security, so multi-store dispensary performance tracking can land in your inbox without manual work.
- Reports like Inventory Adjustments, Reorder, and Cash Out Details include built-in shrinkage, stock-level, and variance calculations that make location-to-location comparison straightforward.
Sales Performance (Metrics 1–3)
Metric 1: Revenue per Location (Week/Month/Year-to-Date)
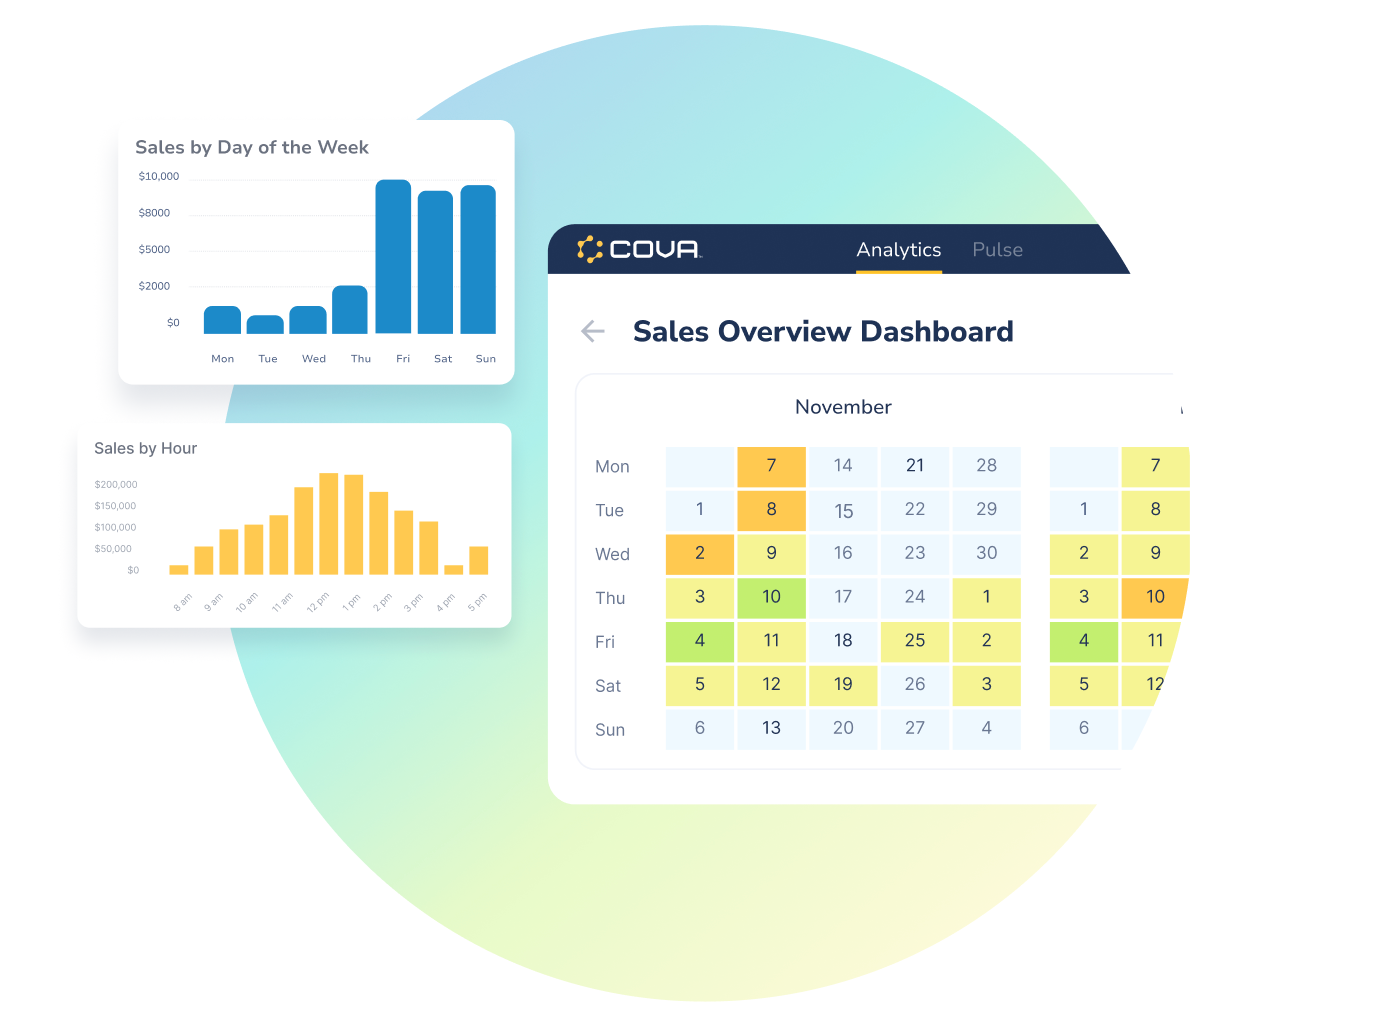
Revenue per location, tracked week-to-date, month-to-date, and year-to-date, is the foundation of any multi-location dispensary reporting setup. Cova's Sales Overview Dashboard displays WTD, MTD, and YTD sales alongside month-over-month and year-over-year comparisons, with the ability to right-click any month to drill down by location and see the full store hierarchy. The Monthly Dashboard highlights which locations are trending up or down compared to last month, along with the exact dollar change.
This matters because a location quietly trending down 12% while its peers stay flat needs investigation now, not at quarter close. Comparing revenue across stores also tells you which location's practices are worth replicating elsewhere and helps you set realistic, location-specific targets instead of applying one company-wide number to stores with very different customer bases.
Cova reports: Sales Overview Dashboard (WTD/MTD/YTD, drill-down by location). Monthly Dashboard (location change comparison). Location Dashboard (Gross Margin per location, Change Log). Hub: Sales by Location report (Gross Sales, Subtotal, Total Invoiced, Gross Profit, Gross Margin % per location).
Metric 2: Average Transaction Value
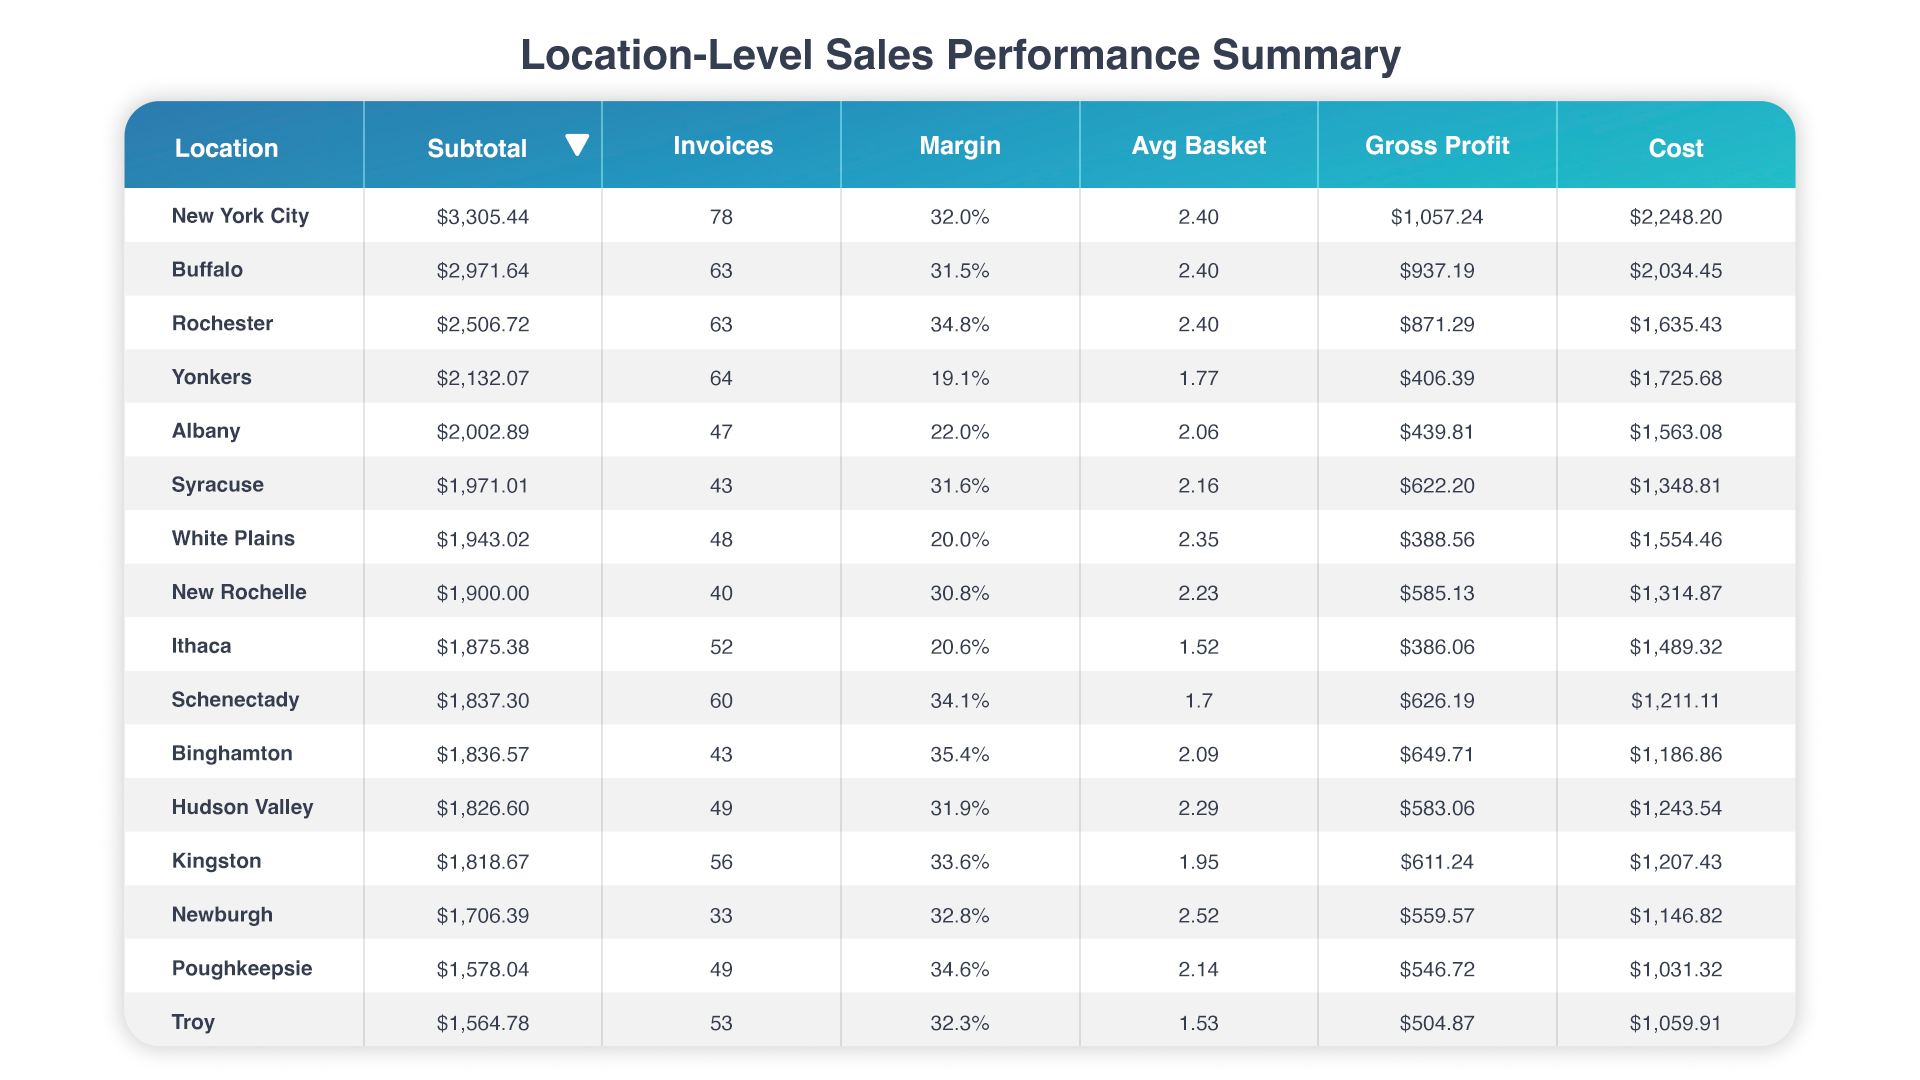
Average transaction value tells you how much each customer spends per visit, and it varies more across locations than most operators expect. The Sales by Location report calculates Transaction Average as Subtotal divided by Count of Invoices for each location, giving you a direct, apples-to-apples comparison – one of the clearest dispensary KPIs for spotting underperforming locations quickly.
A location with a lower average transaction value than its peers is leaving revenue on the table. That usually traces back to one of a few causes: undertrained staff missing upsell opportunities, a weaker product assortment, or fewer cross-sell moments built into the sales process. Pairing this metric with Items Per Transaction and Qty Per Transaction (also in the Sales by Location report) helps you isolate whether the gap is about basket size or basket value.
Cova reports: Sales by Location report (Transaction Average, Items Per Transaction, Qty Per Transaction). Daily Dashboard (today vs 30-day daily average).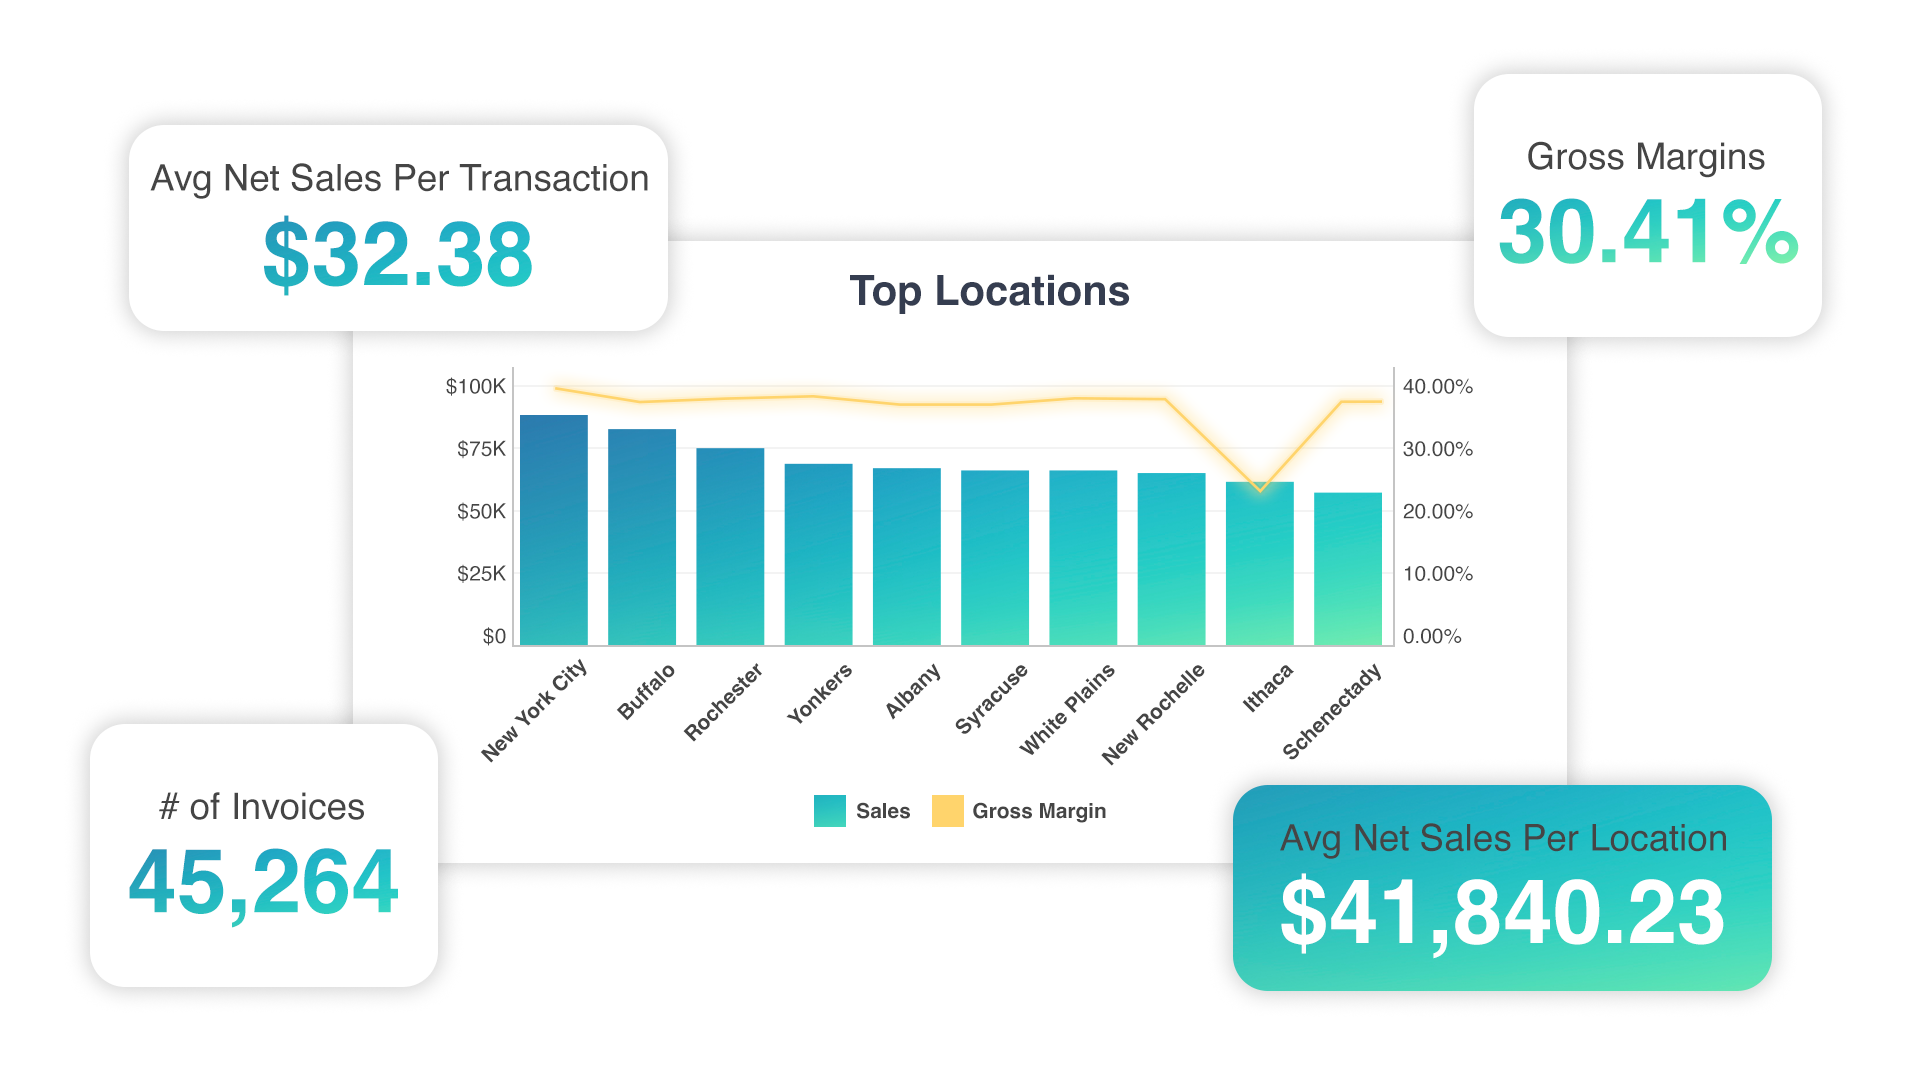
Metric 3: Sales by Time of Day
Knowing when customers actually shop at each location, broken down by hour and day of week, is one of the more underused comparisons in multi-store dispensary reporting. Cova’s Scheduling and Traffic Dashboard highlights above-average periods automatically and shows both sales dollars and invoice counts, so you can tell whether a busy stretch is driven by traffic volume or by a few high-value transactions.
This connects directly to labor efficiency. A downtown location may peak at lunch while a suburban store peaks after 5 p.m. Scheduling identical shifts across both wastes payroll at one and understaffs the other during its real rush. Comparing time-of-day patterns across the chain lets you build store-specific schedules instead of a one-size-fits-all template.
Cova reports: Scheduling and Traffic Dashboard (sales by hour/day of week, above-average highlighting, product filtering, location breakout). Hub: Sales by Day report (Invoices Sold, Transaction Average per day). Itemized Sales report (Hour and Day of Week columns).
Inventory Health (Metrics 4–6)
Metric 4: Inventory Turnover Rate
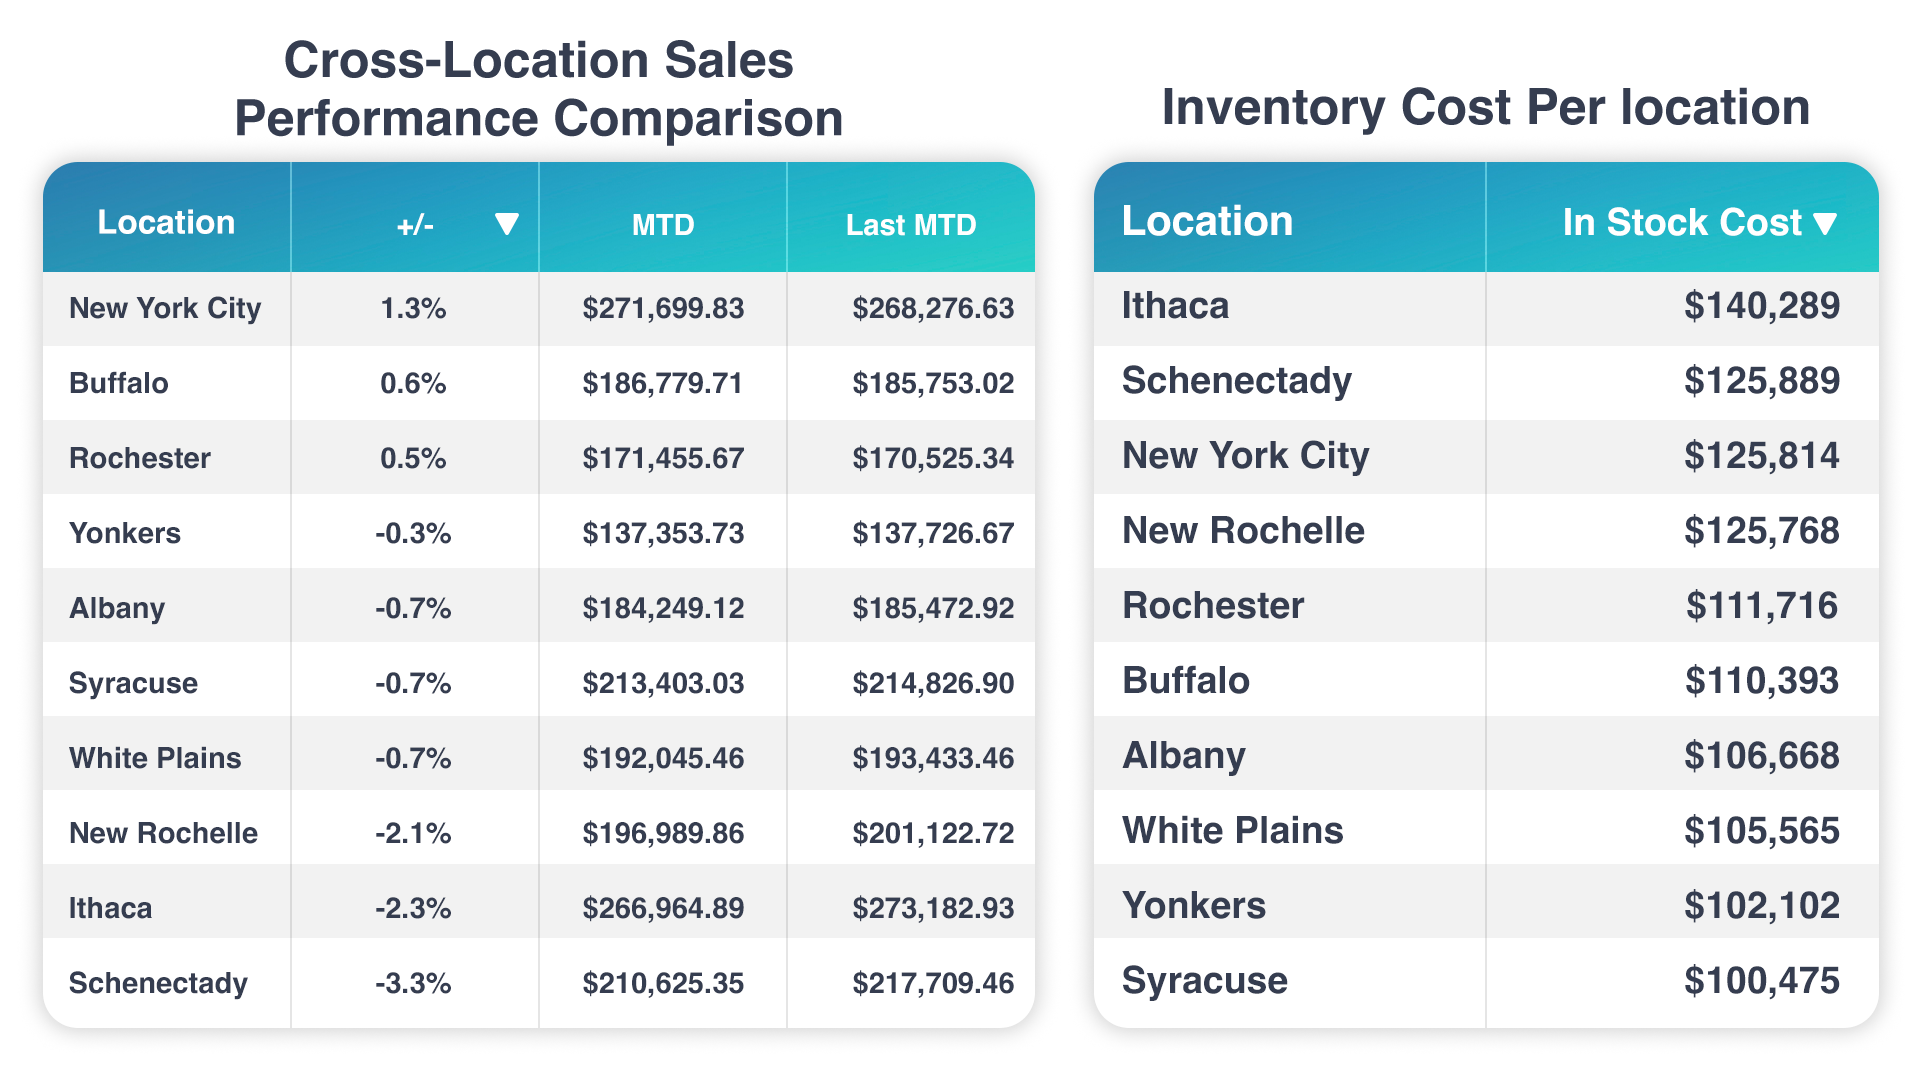
Inventory turnover tells you how quickly each location is selling through its stock, calculated by dividing Cost of Goods Sold by average inventory value. The Inventory by Product Historical report can be run for any past date and location, so pulling in-stock values at the start and end of a month gives you the inputs to calculate turnover per store. This is one of the dispensary KPIs that directly links your inventory management decisions to cash flow.
Slow-turning locations tie up capital in unsold product, while fast-turning locations risk stockouts that send customers to a competitor. Comparing turnover across stores helps you reallocate purchasing budgets and move slow-moving inventory before it becomes dead stock. The Inventory On Hand by Product report's Days Since Last Sold column adds another layer here – though it’s worth noting this figure is calculated at the company level, not per location, so use it alongside location-specific reports rather than as a standalone store comparison.
Cova reports: Inventory by Product Historical report. Reorder Report (Days of Stock Left 7/14/30/60, Days Out of Stock, Minimum Stock). Inventory On Hand by Product (Days Since Last Sold at location level).
Metric 5: Shrinkage Rate
Shrinkage rate shows where inventory is going missing and at which locations it's happening most; this is a critical dispensary performance indicator in a heavily regulated industry where inventory discrepancies can create compliance exposure. The Inventory Adjustments Report includes Shrinkage Cost and Shrinkage % columns, filterable by location, and the Count Name field links directly to the originating inventory count so you can trace a discrepancy to its source without leaving the report.
A location running 3% shrinkage when the rest of the chain averages 1% has a loss prevention issue costing real money, whether that's theft, process breakdowns, or counting errors. The Inventory Count Details report adds a Difference column (comparing Stock At Count to actual Count) and a Cost Difference figure, letting you quantify the dollar impact of each discrepancy rather than just flagging that one exists.
Cova reports: Inventory Adjustments Report (Shrinkage Cost, Shrinkage %, Location filter). Inventory Count Details (Difference column, Cost Difference, hyperlinked count name).
Metric 6: Dead Stock and Product Expiration
Dead stock and approaching expiration dates are two sides of the same inventory problem: product sitting on shelves instead of generating revenue. The Products to Archive report is built specifically to identify products that haven't sold in an extended period, with a configurable Days Since Last Sold parameter. The Product Expirations report separately flags packages by Expiration State (expired or expiring soon) and Days Until Expiration, based on the earlier of the package's expiration date or use-by date.
Comparing dead stock across locations through consolidated cannabis analytics often reveals over-ordering or a product-market fit problem at specific stores. A product gathering dust at one location may be moving briskly at another, which points to a transfer opportunity instead of a markdown. The Product Expirations report lets you run targeted promotions on near-expiry inventory before it becomes a compliance write-off.
Cova reports: Inventory On Hand by Product (Days Since Last Sold at location level). Products to Archive report. Product Expirations report (Days Until Expiration, Expiration State, Use By Date).
Product Mix & Margin (Metrics 7–9)
Metric 7: Top Products and Brand Trends
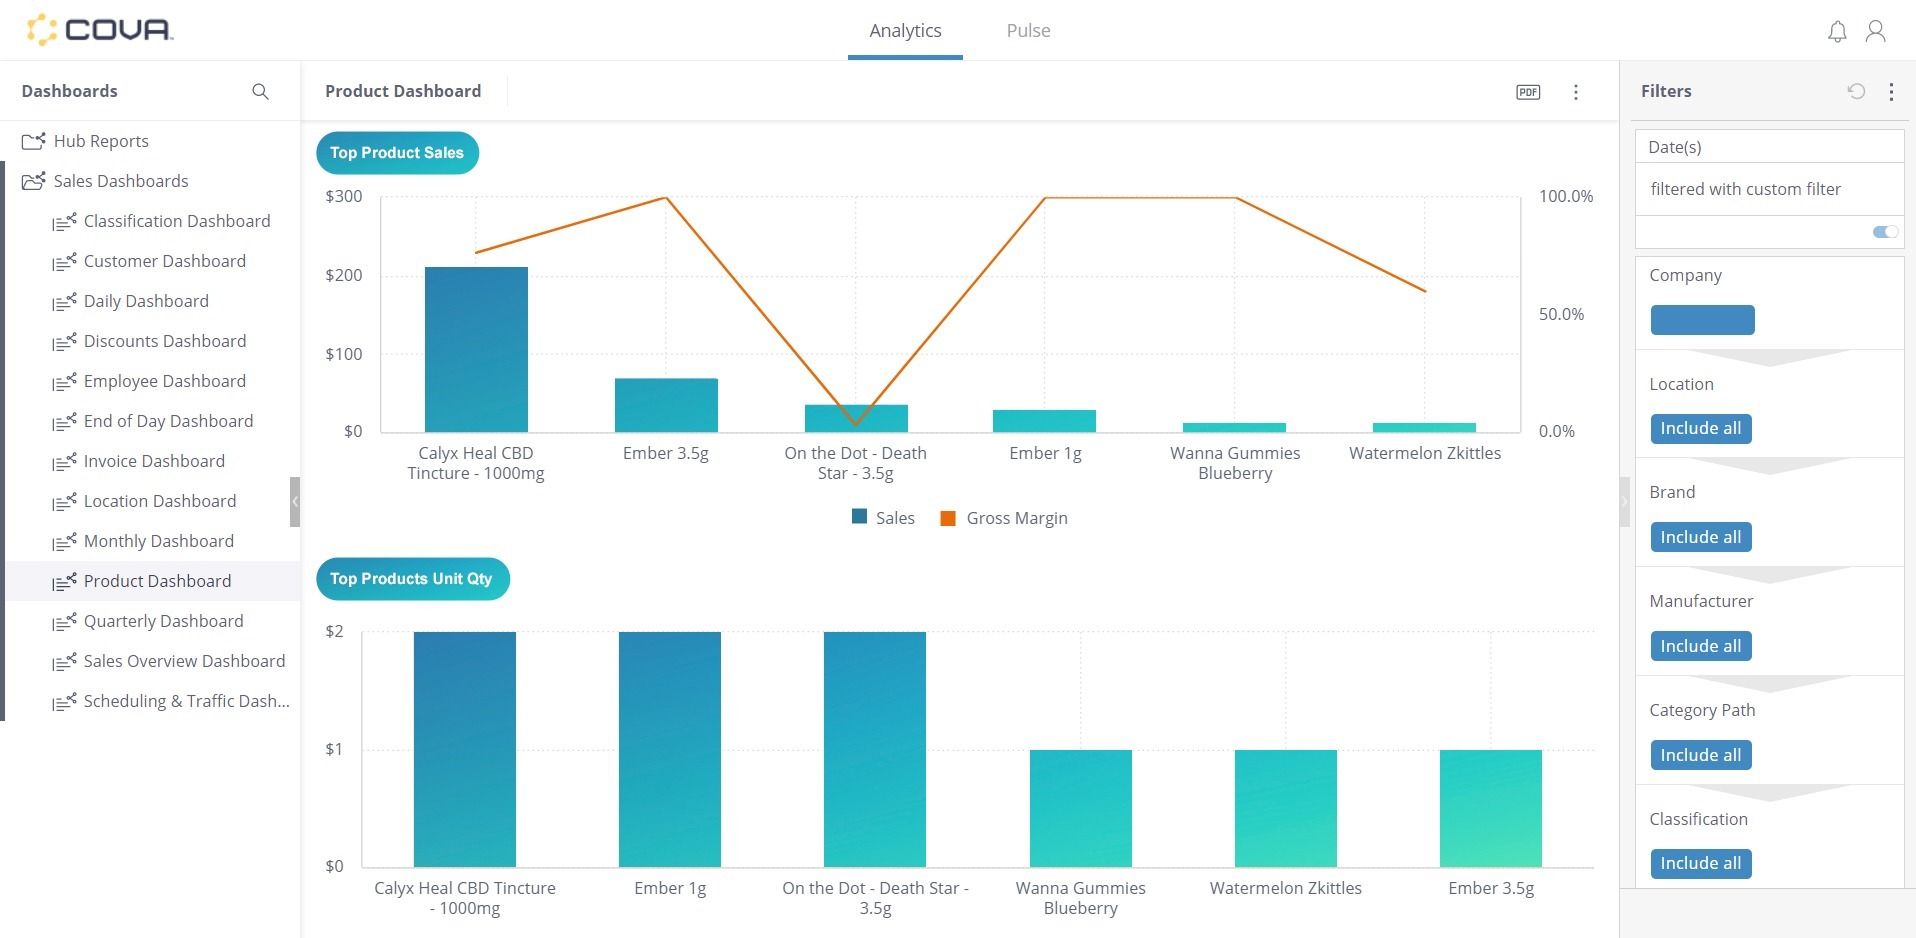
Which cannabis products and brands are gaining or losing ground at each location is one of the dispensary KPIs that most directly shapes purchasing decisions. The Monthly Dashboard compares the current month to both last month and the same month last year, with the ability to drill down from brand to classification to individual product.
Different top sellers across locations reveal local demand patterns that a uniform company-wide assortment will always miss. A brand trending down at one store while holding steady elsewhere may point to a local competitor or shifting demographics, not necessarily a product problem. The Hub Sales by Product report provides the underlying export data for deeper analysis.
Cova reports: Monthly Dashboard (product/brand/classification trends with drill-down). Product Dashboard (Avg # of Products Per Transaction). Sales by Product report (Gross Sales, Gross Profit, Gross Margin %, Brand).
Metric 8: Profit Margin by Product per Location
The same product can generate meaningfully different margins at different stores, and tracking this across your dispensary chain is how you catch pricing inconsistencies before they quietly compound. The Inventory On Hand by Product report includes Profit Margin ($), Profit Margin (%), and Markup percentage, calculated per location using Retail Value In Stock against In Stock Cost.
If a product runs 45% margin at one location and 30% at another, that gap usually traces back to inconsistent pricing, different supplier cost bases, or heavier discounting at one store. This metric helps standardize pricing policy across the chain, identify where supplier terms need renegotiating, and flag locations where aggressive discounting is eroding margin on top sellers.
Cova reports: Sales by Product & Location report (Gross Profit, Gross Margin %, Total Discount, Markdown %, Avg Regular Price, Avg Sold At Price). Inventory On Hand by Product (Profit Margin $, Profit Margin %, Markup % with Location parameter).
Metric 9: Strain and Weight Popularity
Which strains and package sizes customers actually buy varies by location, and understanding that variation is essential for stocking each store to its actual market rather than a generic average. The Inventory On Hand by Package report includes a Strain column along with THC % and CBD % at the package level. The Monthly Dashboard also shows strain popularity and net weight trends directly.
If one location sells predominantly larger package sizes while another skews toward smaller formats, the customer base is different, and purchasing should reflect that. Matching inventory to each store's real preferences reduces dead stock from poorly matched assortment and supports more targeted, location-specific promotions.
Cova reports: Monthly Dashboard (strain popularity, net weight analysis). Inventory On Hand by Package (Strain, THC %, CBD %). Sales by Product report (Net Weight, Total Net Weight, Unit Type).
Staff & Operations (Metrics 10–12)
Metric 10: Revenue per Employee
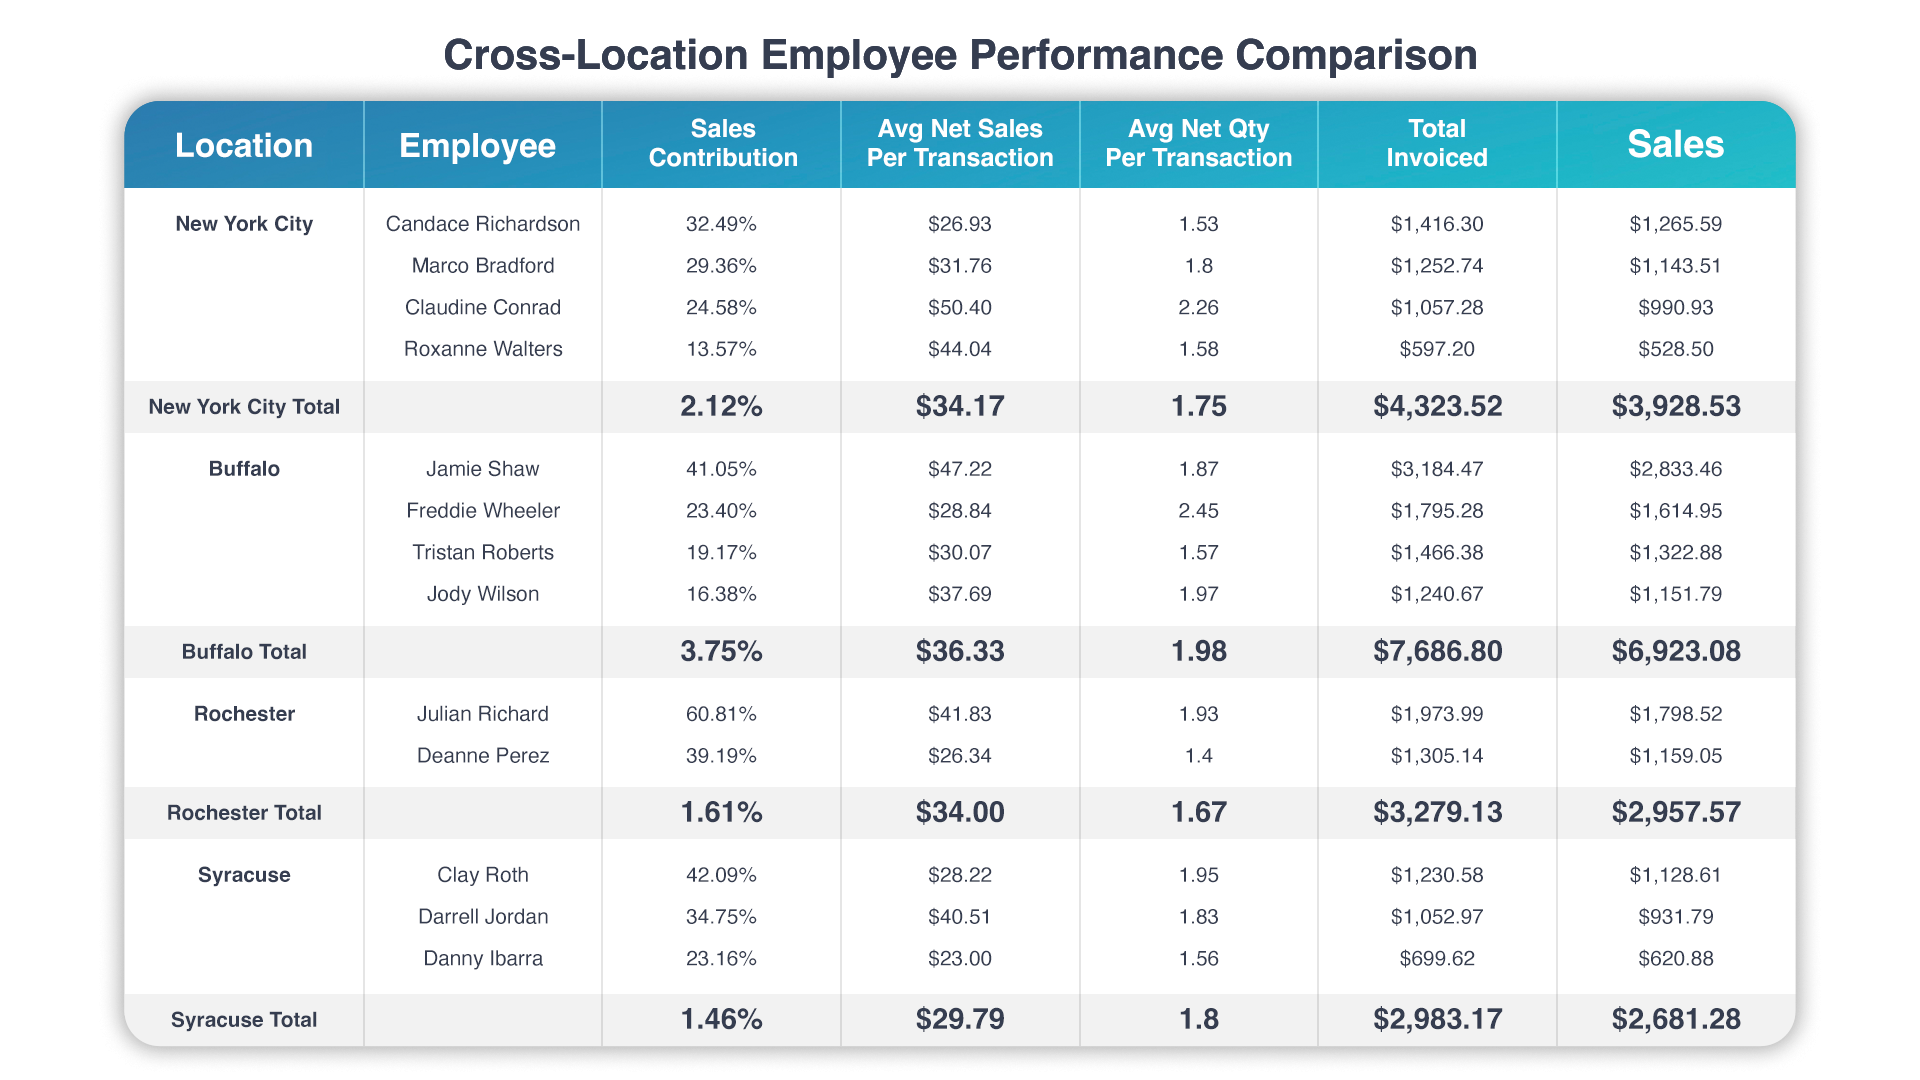
Revenue per employee shows how each budtender contributes to store performance, and comparing it across locations – not just within a single store – is how you identify your strongest performers and the coaching opportunities that exist chain-wide. The Sales by Employee (Tendered) report includes Invoices Sold, Items Per Transaction, Qty Per Transaction, Transaction Average, Gross Sales, Gross Profit, and Gross Margin % per employee, filterable by location.
This reveals top performers worth recognizing and replicating, and flags which employees at which locations could use coaching on upselling or basket building. The report distinguishes Created versus Tendered employee, which matters for split-role workflows where one person takes the order and another completes the sale. Normalize by shift hours for a fair comparison rather than raw totals.
Cova reports: Sales by Employee (Tendered) report (revenue and basket metrics per employee, Location parameter). Sales by Employee (Created) report (for order-taking workflows). Daily Dashboard (employee breakdown).
Metric 11: Discount Activity per Employee and Location
Tracking who is applying discounts, how often, and why is both a margin question and a fraud prevention question. Cova’s Discounts Dashboard shows invoices discounted per pricing group, and the underlying Discounts Report breaks out Discount Reason, Discount Type, Employee, and Location; this gives you the data to compare discount behavior across your entire dispensary chain in one view.
Locations or individual employees with unusually high discount rates may be over-relying on promotions to close sales, or in some cases applying discounts they shouldn't be. This metric also helps evaluate which promotions are genuinely driving incremental revenue versus simply discounting sales that would have happened anyway.
Cova reports: Discounts Report (Discount Reason, Discount Type, Employee, Markdown %, Location). Discounts Dashboard (reason code analysis, invoices per pricing group chart). Sales by Invoice (Sales Override Name column).
Metric 12: New vs. Returning Customers
How well each dispensary retains customers, and how effectively it attracts new ones, is a direct signal of store-level health that revenue alone won't reveal. The Customer Activity List report includes Days Visited, Number of Invoices, Average Spent, Days Since Last Visit, First Invoice Date, and geographic fields like City, State, and Postal Code.
A location with a low rate of returning customers has a retention problem worth investigating: product selection, service quality, or local competition are the usual suspects. The Days Since Last Visit field identifies at-risk customers before they fully churn, and the geographic data helps clarify each store's actual catchment area, which often differs from assumptions based on the storefront's address alone.
Cova reports: Customer Activity List report (# Days Visited, # Invoices, Avg Spent, Days Since Last Visit, geographic data). New Customers report. Customer Dashboard (Total Sales By Month/Year, Avg Spend Per Invoice By Month). Daily and Monthly Dashboards (new vs returning customer counts).
Compliance & Cash (Metrics 13–15)
Metric 13: Cash Variance
Cash variance shows whether each location's drawer balances at close, and in a cash-heavy industry, tight controls here are both a compliance requirement and a fraud safeguard. The Cash Out Details report includes an Expected Amount column showing exactly how the Over/Short figure is calculated, and bank deposits and safe closes appear as separate line items with a Deposit # for audit trails.
Comparing cash variance across locations identifies which stores handle cash accurately and which have process breakdowns or training gaps. The Expected Amount calculation removes guesswork from end-of-day reconciliation, making the comparison a matter of pulling the report rather than reconstructing it manually.
Cova reports: Cash Management Report (Location filter). Cash Out Details (Expected Amount, Over/Short, separate deposit lines, Deposit #).
Metric 14: Transfer Volume and Velocity
How much product moves between locations, and how long each transfer takes, tells you whether your purchasing allocation across stores is actually working. High transfer volume between two specific locations in your dispensary chain usually means the original purchasing split was off. The Transfers Report shows Ship From, Ship To, Status, Created On, Last Received On, and Completed On for every transfer.
Slow completion times point to receiving bottlenecks that leave product sitting in transit instead of on the shelf. Cross-referencing with the Reorder Report's Minimum Stock and Days of Stock Left columns helps calibrate purchasing by location and reduce the need for inter-store transfers over time.
Cova reports: Transfers Report (Ship From, Ship To, Status, Created On, Completed On, Last Received On). Reorder Report (Days Out of Stock, Minimum Stock).
Metric 15: Sales Forecast vs. Actual
Comparing each location's actual sales against its projected forecast is one of the more powerful ways to separate consistent performers from volatile ones in a multi-store operation. Cova’s Daily Dashboard projects sales based on historical data with a configurable lookback window, giving each location its own baseline to measure against.
A store that consistently beats its forecast may have untapped potential worth a higher target. One that consistently misses may be dealing with external factors like new competition, construction, or seasonal shifts – or an operational issue worth a closer look.
Cova reports: Daily Dashboard (sales forecast with configurable window, history period, anomaly handling, and upper/lower bounds).
FAQ
What reports do multi-location dispensaries need for cross-store comparison?
The core reports for multi-location dispensary reporting are the Sales by Location report (revenue, transaction averages, and basket metrics per store), the Inventory Adjustments Report (shrinkage by location), the Reorder Report (stock levels and days of stock remaining), the Transfers Report (inter-store product movement), and the Cash Out Details report (cash variance per location). Cova's dashboards layer on top of these for at-a-glance performance monitoring across the chain.
Can I automate the delivery of cross-location reports?
Yes. Hub Reports support email subscriptions, which let you schedule any report to be delivered automatically with custom parameters, including location filters, on a set schedule to specific recipients. Every Hub Report also generates a unique, bookmarkable URL once parameters are selected, so operators can save their most-used multi-store report configurations for one-click access rather than rebuilding from scratch each time.
How do I compare dispensary locations if I have stores in different regulatory markets?
Operators running stores across state lines, or across medical and recreational markets, need to account for different product rules, pricing environments, and customer bases. Filtering reports by classification and consumer type helps segment the data for a fairer comparison. Lean on metrics that normalize for market differences, like margin percentages and turnover rates, rather than raw revenue, which can be misleading when comparing a medical-only store to a high-volume recreational one.
How do I spot underperforming dispensary locations quickly?
Start with revenue per location compared to the prior period and to peers. Then layer in average transaction value and shrinkage rate. A store that's down in revenue, running below-average transaction values, and showing elevated shrinkage has three compounding problems that need separate investigation. Cova's scheduled report subscriptions can surface these signals automatically each morning rather than requiring a manual pull.
How does Cova handle location-level security in multi-location dispensary reporting?
Cova's reporting uses location-based security roles, so store managers see only their own location's data while regional managers and executives see the full picture across all stores. This applies to both report access and email subscriptions, meaning a regional manager receives automated reports scoped to just their assigned locations.
Learn more about Cova reports in our Advanced Reporting Dashboards video.
Getting Started
Tracking these 15 cannabis industry KPIs matters less than comparing them across locations. A single number in isolation tells you how one store is doing. The same number set against three, five, or twenty peers tells you where to reallocate inventory, which staffing patterns to fix, which stores need attention now, and which ones you should be learning from.
Start with the three or four metrics most relevant to your current priorities rather than implementing all 15 at once. If shrinkage has been creeping up, start with Metric 5 and the Inventory Adjustments Report. If you're planning next quarter's purchasing, Metrics 4, 6, and 14 will tell you more than a single dashboard glance ever could.
Centralized reporting for multi-location dispensaries is exactly what Cova's Hub Reports and dashboards are built for, with location-level filters, automated email delivery, and security roles that keep each store's data scoped to the right people. See how Cova's cannabis retail analytics tools support multi-store operators, or book a demo to walk through the reports against your own location data.