
The legal cannabis industry is at an inflection point. After more than a decade of near-uninterrupted growth, the latest cannabis industry statistics show a market moving into a more complex phase of regulation, price pressure, and consumer normalization. In 2025, U.S. regulated cannabis sales declined year over year for the first time. Federal rescheduling advanced, while a sweeping federal restriction on hemp-derived THC moved toward full enforcement. Fifty percent of Americans have now tried cannabis (Gallup), up from just 4% in 1969.
For dispensary owners and operators, this cannabis industry data isn't abstract; it shapes decisions on where to expand, how to price, what to stock, and how to staff. This resource compiles 150+ statistics drawn from government surveys, peer-reviewed research, and leading industry reports across topics including cannabis market size, state-by-state sales, dispensary counts, profitability, and more. Every data point is cited, and methodology is explained where figures vary between sources.
Key Takeaways
- U.S. regulated cannabis revenue declined for the first time in 2025, falling to approximately $28.6–$29.6 billion, with 23 states posting sales declines (Whitney Economics); price compression, tax burdens, and competition from hemp-derived THC substitute products were the cited factors
- Only 24.4% of U.S. cannabis operators are profitable on an after-tax basis, compared to 65% of all U.S. small businesses (MJBizDaily / Whitney Economics)
- 87% of Americans support cannabis legalization in some form, while teen use remains near historic lows (Pew Research / Monitoring the Future)
- Roughly 75% of total U.S. cannabis consumption still flows through the illicit market, putting the combined legal and illegal market value around $100 billion (Whitney Economics)
Cannabis Usage Statistics
In 2024, approximately 44.3 million Americans used cannabis in the past month, and 64.2 million reported past-year use, according to the Substance Abuse and Mental Health Services Administration's National Survey on Drug Use and Health (SAMHSA NSDUH). The directional trend is clear: use has accelerated steadily since 2021, driven by expanding legal access, shifting cultural attitudes, and an aging population increasingly open to cannabis as a wellness tool.
How Many Americans Use Cannabis?
- 15.4% of Americans age 12 and older used cannabis in the past month in 2024, representing 44.3 million people — up from 13.2% (37 million) in 2021 (SAMHSA NSDUH 2024)
- 22.3% reported past-year use, totaling 64.2 million people (SAMHSA NSDUH 2024)
- 15% of Americans self-identify as current cannabis smokers (Gallup, combined data 2023–2024)
- 47% of Americans have tried cannabis at least once, up from just 4% in 1969 (Gallup)
- Young adults age 18–25 represent the highest-use cohort, with 24.1% reporting past-month use (SAMHSA NSDUH 2024)
- Adolescents age 12–17 reported 6.0% past-month use (SAMHSA NSDUH 2024)
- 38% of current cannabis users vaped cannabis in the past month (SAMHSA NSDUH 2024)
Who Is Using Cannabis?
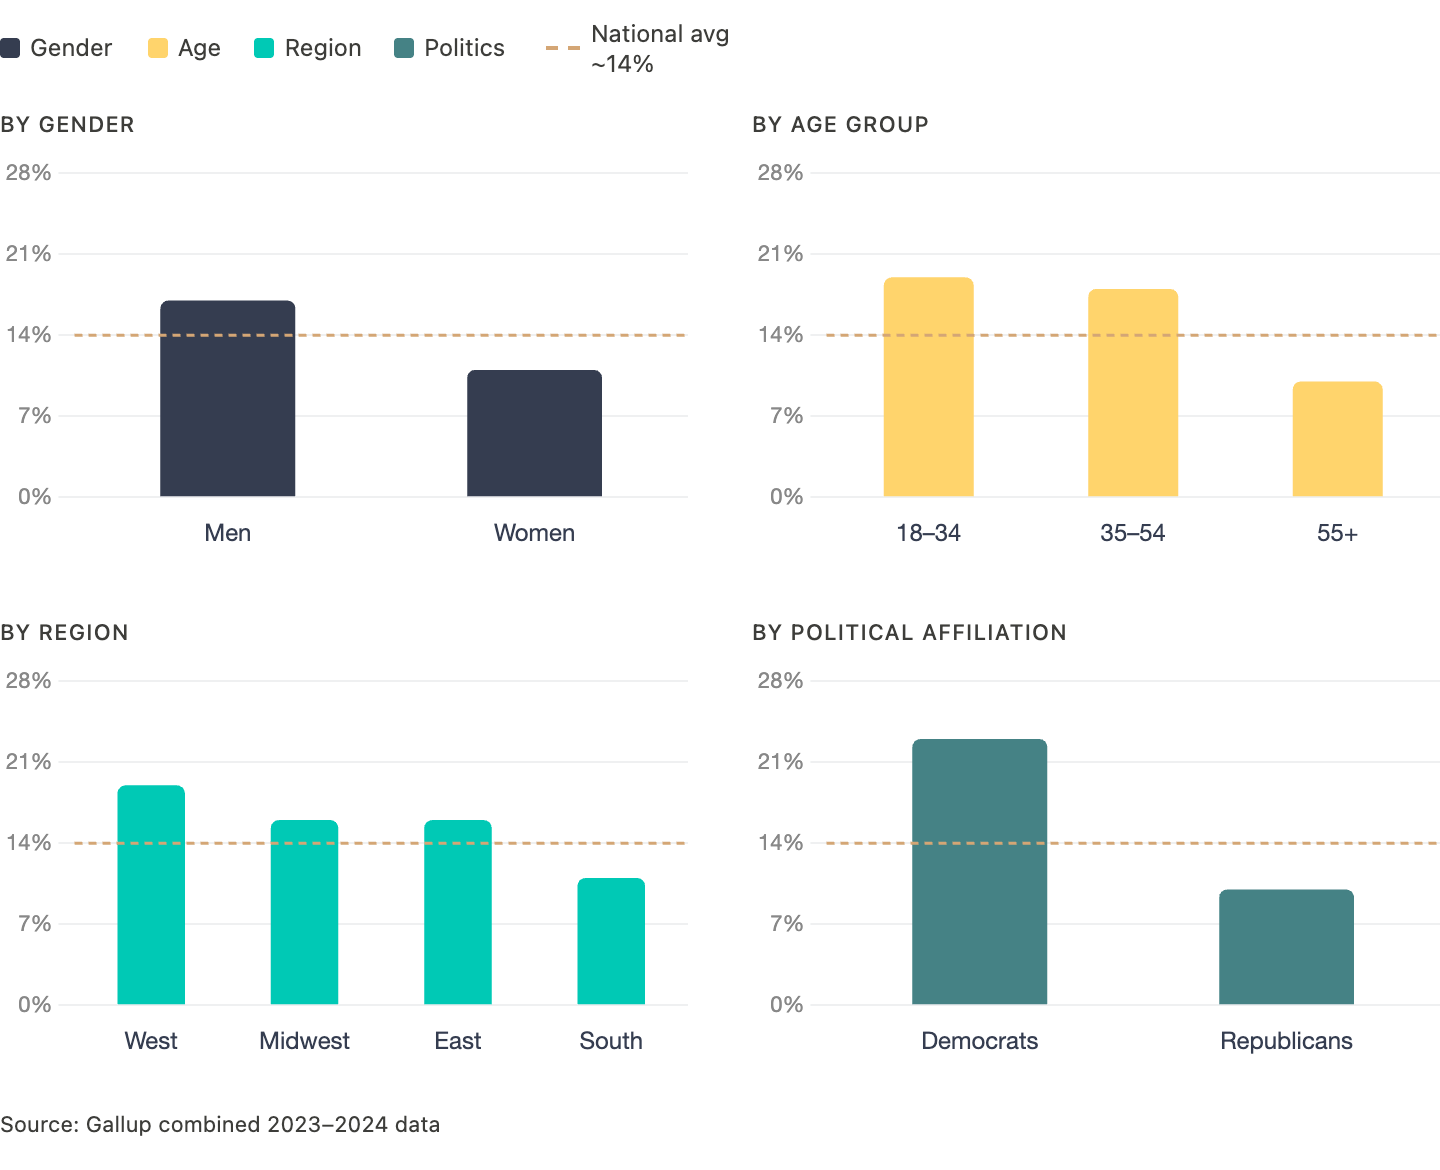
Usage rates vary significantly by gender, age, region, and political affiliation, according to Gallup's combined 2023–2024 data:
- Men (17%) are more likely than women (11%) to report current use
- By age group: adults ages 18-34 report 19% usage, middle-aged (35-54) adults 18%, and adults 55 and older 10%
- By region: the West leads at 19%, followed by the Midwest and East at 16%, and the South at 11%
- Democrats (23%) are more than twice as likely as Republicans (10%) to report current use
Cannabis Use Among Older Adults
One of the fastest-growing user segments is adults 65 and older. According to a 2025 study from NYU's Center for Drug Use and HIV/HCV Research (CDUHR):
- 7% of adults 65 and older used cannabis in the past month in 2023, up from 4.8% in 2021
- That represents a roughly 46% increase in just two years
- College-educated, married, female, and higher-income older adults are driving the majority of that growth
The 65-and-older cohort is particularly significant for dispensary operators. This group tends to use cannabis for therapeutic purposes like pain, sleep, and anxiety, and responds well to knowledgeable budtender guidance and product education.
Women Represent a Growing Share of Consumers
- More than 1 in 3 women over 21 now consume cannabis (Forbes)
- Women aged 19-30 surpassed men in cannabis consumption rates for the first time in 2023 (NIDA)
Cannabis Use Disorder
Not all cannabis use is recreational or therapeutic in effect. Cannabis use disorder (CUD) is characterized by a “problematic pattern of cannabis use leading to clinically significant impairment or distress,” according to the Diagnostic and Statistical Manual of Mental Disorders. SAMHSA's 2024 national survey found that 20.6 million Americans meet the clinical criteria for CUD, while the CDC estimates approximately 3 in 10 cannabis users have the disorder.
Teen Use Remains Near Historic Lows
Despite longstanding concerns that legalization would increase youth access, the data points consistently in the opposite direction. According to the 2025 Monitoring the Future survey conducted across 23,726 students in 270 schools:
- 8th graders: approximately 8% past-year use
- 10th graders: approximately 16% past-year use
- 12th graders: approximately 26% past-year use
- 2025 marks the fifth consecutive year near historic lows first set in 2021
- Daily marijuana use now exceeds daily cigarette use across all three grade levels surveyed
- Among teen cannabis users, 71.1% vaped cannabis — a consumption method that carries distinct health implications and underscores why product format data matters in policy discussions (SAMHSA NSDUH 2024)
Since states began legalizing adult-use cannabis in 2012, past-30-day use among teens has declined 28–46% across all three grade cohorts tracked by Monitoring the Future.
Cannabis Market Size & Revenue
 In 2026, U.S. regulated cannabis sales are forecast to reach $30.5 billion, a
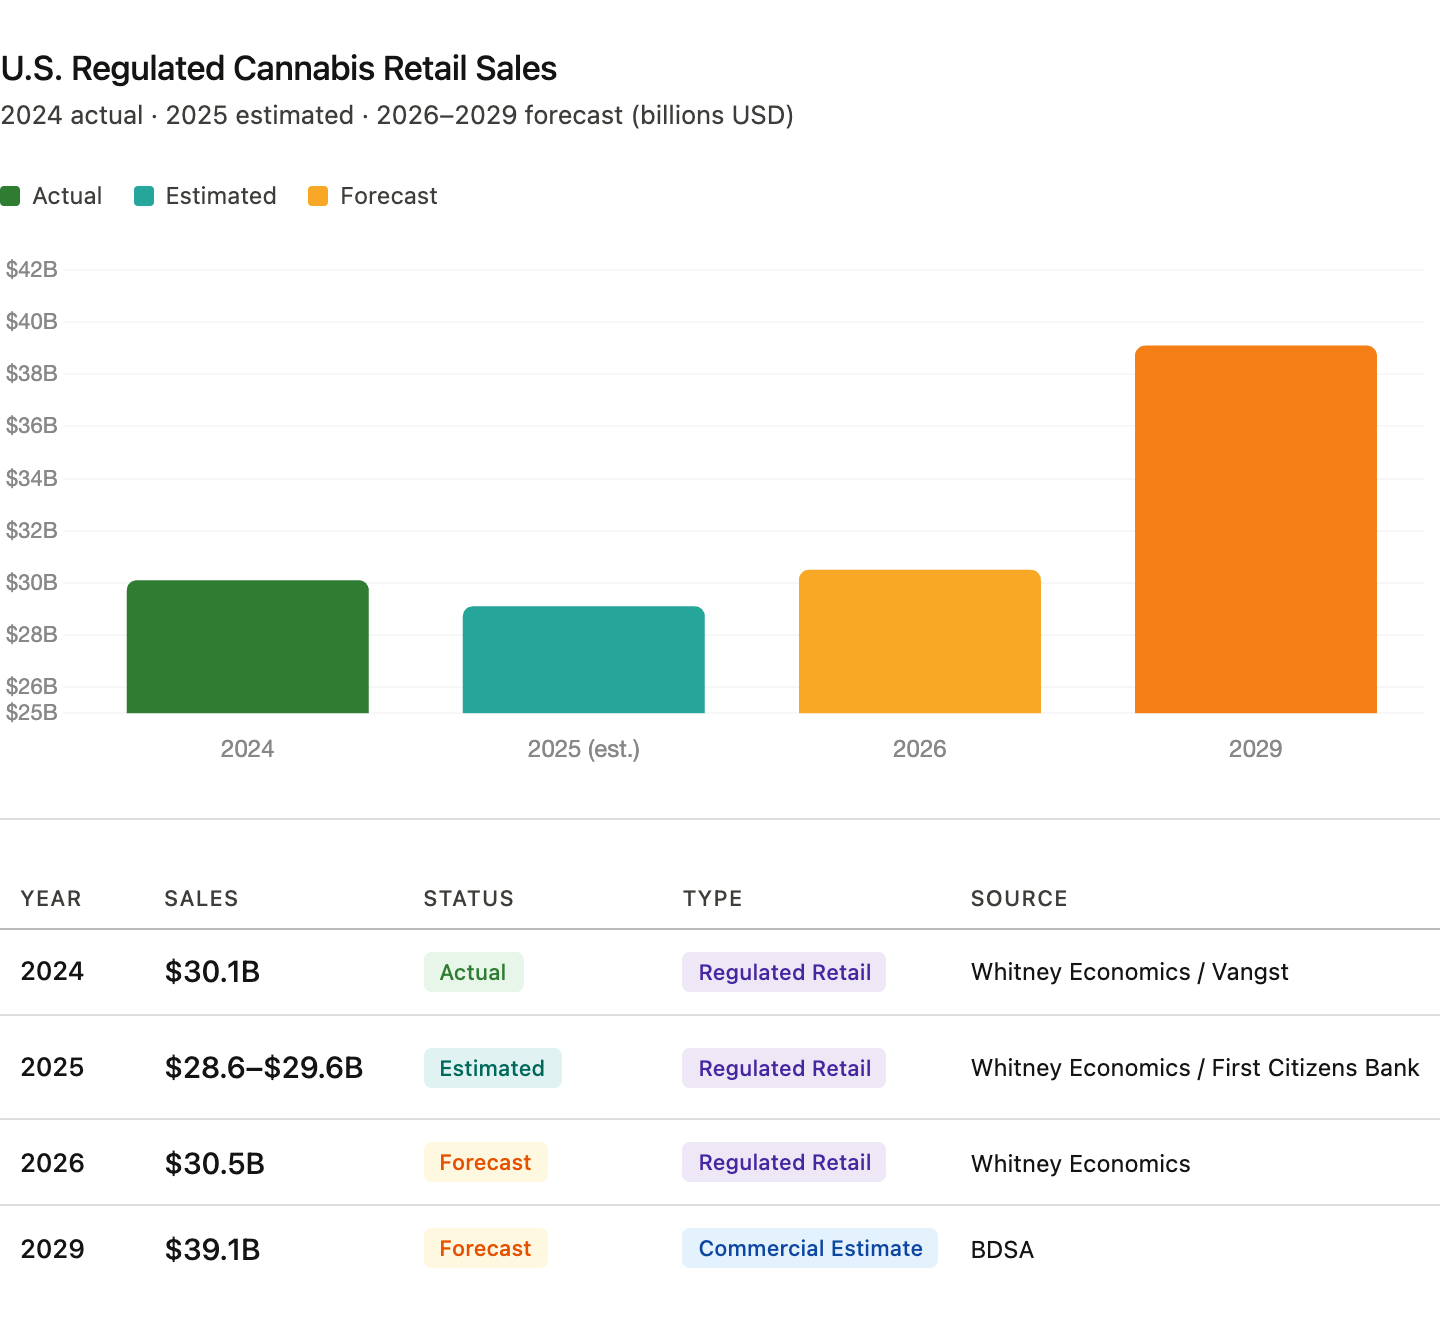
projected 4.9% rebound from the prior year. Sales reached $30.1 billion in
2024 but declined for the first time in 2025, falling to approximately $28.6–$29.6 billion according to Whitney Economics. For context, the industry went from essentially zero in 2012 to $30 billion in regulated sales in roughly twelve years; that’s a remarkable growth arc now entering a consolidation phase.
A note on methodology: Market size figures vary widely depending on what is being measured. Whitney Economics and First Citizens Bank track regulated retail sales — actual dispensary transactions reported to state agencies. Firms like Grand View Research and Statista model a total addressable market that includes hemp, CBD, and other adjacent categories. These are not interchangeable figures, and presenting them side by side without labeling the methodology is one of the most common sources of confusion in cannabis market reporting. This section labels each figure accordingly.
U.S. Regulated Retail Sales of Cannabis
|
Year |
Sales |
Source / Type |
|
2024 |
$30.1B |
Whitney Economics / Vangst — regulated retail |
|
2025 (est.) |
$28.6–$29.6B |
Whitney Economics / First Citizens Bank — regulated retail |
|
2026 (forecast) |
$30.5B |
Whitney Economics — regulated retail |
|
2029 (forecast) |
$39.1B |
BDSA — commercial estimate |
Broader Market Estimates (Total Addressable Market)
- Statista projects U.S. cannabis revenue will reach $47 billion by 2026 and $55.43 billion by 2030, using a broader definition that includes hemp and CBD products
- Grand View Research estimates the U.S. market will reach $76.39 billion by 2030 at an 11.51% CAGR, using the broadest available market definition
Why Revenue Declined in 2025
The 2025 contraction reflects structural industry stress, not a drop in consumer demand. Consumers didn't stop buying cannabis; they shifted purchasing patterns, found cheaper alternatives, or continued buying through unlicensed channels.
- 23 states saw regulated sales decline in 2025 (Whitney Economics)
- More than 4,000 cannabis businesses surrendered their licenses over an 18-month period (Whitney Economics)
- Price compression, tax burdens, and competition from hemp-derived THC substitute products were the cited factors (Whitney Economics)
- Only 24.4% of cannabis operators are currently profitable on an after-tax basis (MJBizDaily)
Price Compression: The Underlying Structural Force
Wholesale price data tells the story of a commodity market under sustained pressure. According to Cannabis Benchmarks' Spot Index, which tracks weekly U.S. cannabis flower prices:
- The national wholesale flower spot price fell to a record low of $888/lb in January 2025 before partially recovering to $1,081/lb by May 2026
- Over 11 years, the index declined roughly 36% from its $1,700/lb inception price in April 2015 to $1,081/lb
- Retail gross margins compressed from 52.6% in 2021 to 42.7% in 2025 as wholesale price declines failed to fully offset retail price pressure (Headset)
Wholesale price declines weren't limited to flower. According to LeafLink's 2026 Wholesale Pricing Guide, which tracks platform transaction data:
- Cartridges: -12% YoY
- Pre-rolls: -10.3% YoY
- Concentrates: -7.5% YoY
- Flower: -5.4% YoY
Oregon represents the most extreme example of price collapse: the state holds an estimated 3 million pounds of unsold cannabis flower in storage, with prices falling from $3,000/lb at peak to as low as $100/lb in some cases (OLCC / Canna Law Blog).
Economic Impact
Despite the revenue contraction, cannabis generates significant broader economic activity:
- Total economic contribution reached $123.6 billion in 2025, according to MJBizFactbook modeling
- For every $10 spent at a dispensary, an estimated additional $18 is injected into the broader local economy (MJBizFactbook)
- 87% of cannabis companies anticipate positive revenue growth in 2026 (First Citizens Bank 2026 Cannabis Industry Data Report)
The Illicit Market: The Number That Puts Everything in Context
Legal market figures represent only a fraction of total U.S. cannabis consumption. According to Whitney Economics, approximately 75% of total U.S. cannabis consumption remains in the illicit market, while the combined legal and illicit U.S. cannabis market is estimated at roughly $100 billion. Additionally:
- Legal cannabis costs roughly 30% more than unlicensed equivalents in many states, primarily due to licensing fees, testing mandates, and tax obligations (NPR)
- California seized more than $316 million in illicit cannabis since January 2025 (Office of the Governor of California)
The illicit market's scale is the single most important context for interpreting regulated sales figures, market projections, and operator profitability data. Every dispensary operator competes against it daily at a significant price disadvantage.
Cannabis Sales by State
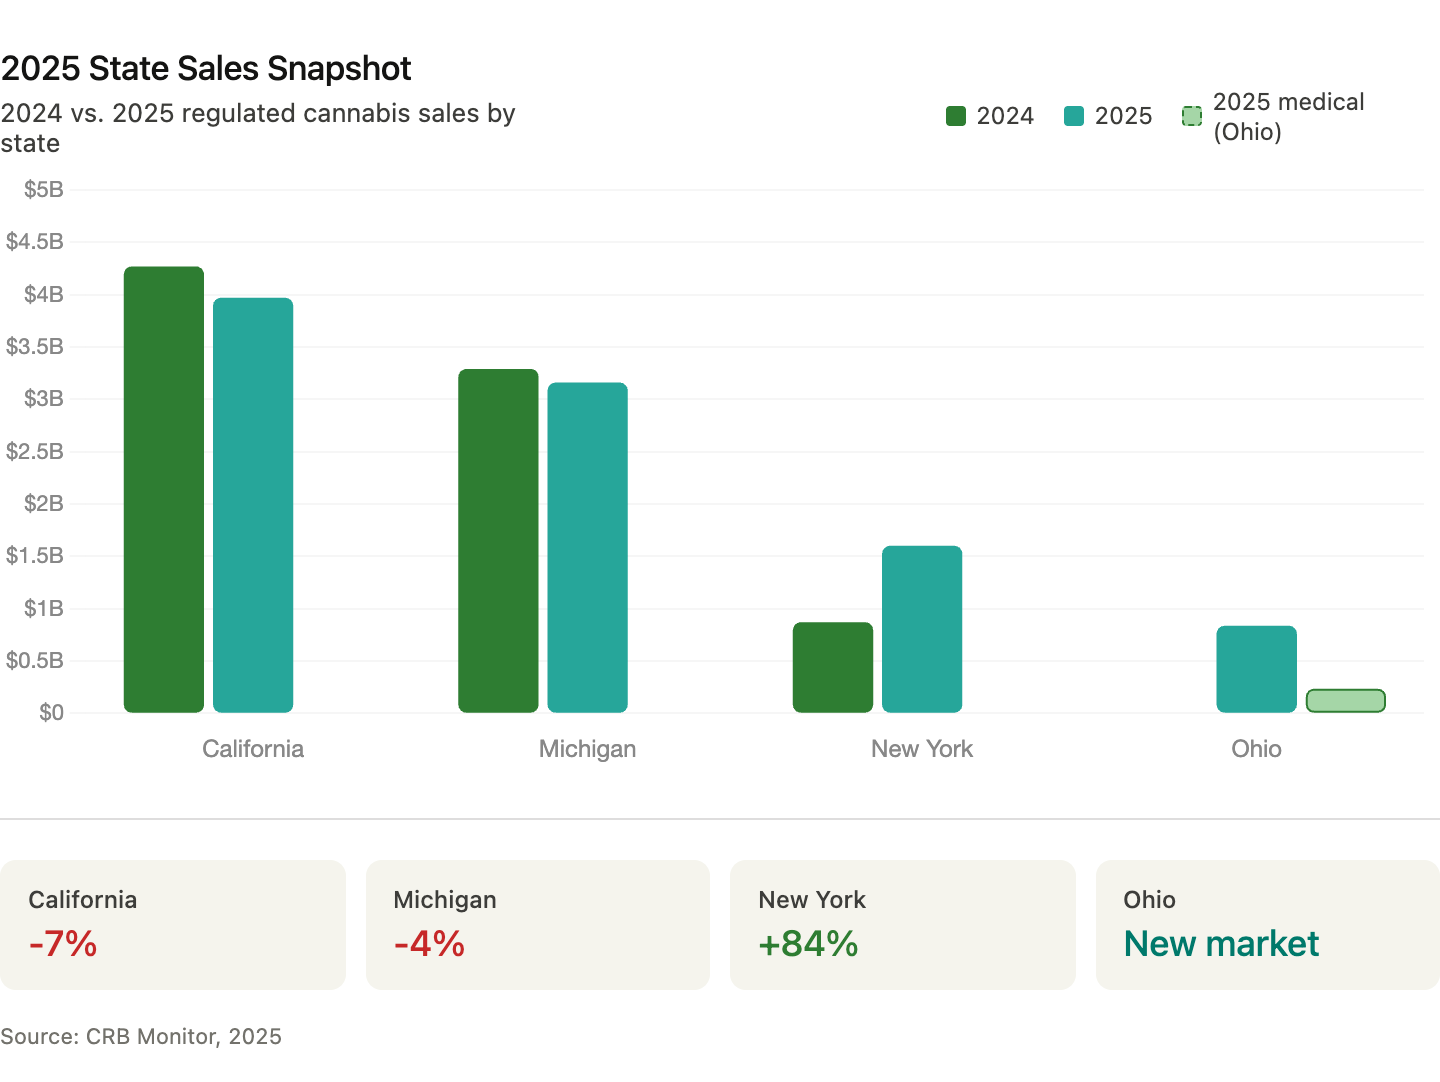
According to CRB Monitor, California remains the largest regulated cannabis market at $3.97 billion in 2025 sales, though it experienced a 7% decline from 2024. New York was the standout growth story, nearly doubling to $1.6 billion in just its second full year of adult-use operations. Ohio's new adult-use market generated $836 million in its first year. The divergence between maturing markets contracting and emerging markets accelerating is one of the defining patterns of 2025.
2025 State Sales Snapshot
|
State |
2024 Sales |
2025 Sales |
Change |
|
California |
$4.27B |
$3.97B |
-7% |
|
Michigan |
$3.29B |
$3.16B |
-4% |
|
New York |
$870M |
$1.6B |
+84% |
|
Ohio |
N/A (new market) |
$836M adult-use + $233M medical |
— |
Source: CRB Monitor, 2025
California's 7% decline reflects the compounding pressures facing mature markets: a large and entrenched illicit market, high retail prices relative to unlicensed alternatives, and intense competition among 3,659 licensed dispensaries for a consumer base that hasn't grown proportionally with supply. Michigan tells a similar story: a 4% decline in a mature market where license counts and price compression continue to squeeze margins.
New York's 84% growth is a different story entirely. The state expanded from approximately 41 licensed dispensaries to more than 300 by mid-2025, with projections of 625 or more by year-end (CRB Monitor). At that trajectory, New York has the potential to become the second-largest cannabis market in the country within the next two to three years — a significant opportunity for operators with early market positions.
Ohio's first full year of adult-use sales produced $836 million in recreational revenue alongside $233 million in medical sales, making it an immediate top-five market by volume. Minnesota, which received 1,322 microbusiness license applications in a single month, signals similar pent-up demand in a market still in early buildout (CRB Monitor).
For operators evaluating expansion into new markets, the divergence between mature and emerging state markets in 2025 offers a useful framework. Mature markets — California, Michigan, Colorado — are characterized by dense license counts, sustained price compression, and declining year-over-year sales as legal operators compete with each other and with the illicit market simultaneously. Emerging markets like New York, Ohio, and Minnesota have the opposite profile: undersupplied relative to demand, faster consumer adoption curves, and less pricing pressure in the near term. The risk profile differs substantially. Mature markets offer established consumer bases and operational infrastructure; emerging markets offer growth upside but carry the execution risk of building in a still-developing regulatory environment.
Number of Dispensaries by State
As of 2024, there were roughly 15,000 cannabis dispensaries in the United States, with 79% of Americans living in a county that contains at least one, according to Pew Research Center. The geographic distribution of those dispensaries reveals the uneven maturation of the U.S. cannabis market: a handful of states account for the majority of licensed locations, while per-capita density varies dramatically — from Oklahoma’s 36 per 100,000 residents at the high end to states with far more restrictive licensing frameworks at the other.
National Dispensary Access
- Total U.S. dispensaries: approximately 15,000 (Pew Research, 2024)
- 79% of Americans live in a county with at least one dispensary (Pew Research)
- 54% of Americans live in a state with legal recreational cannabis (Pew Research)
- 74% live in a state where recreational or medical cannabis is legal (Pew Research)
States with the Most Dispensaries
|
State / Area |
Dispensary Count |
Notes |
|
California |
3,659 |
25% of all U.S. dispensaries |
|
Los Angeles County (CA) |
1,481 |
Single county total |
|
New York |
500+ |
CRB Monitor, 2025 |
|
Oklahoma |
Most per capita |
36 per 100,000 residents |
Source: Pew Research Center / CRB Monitor
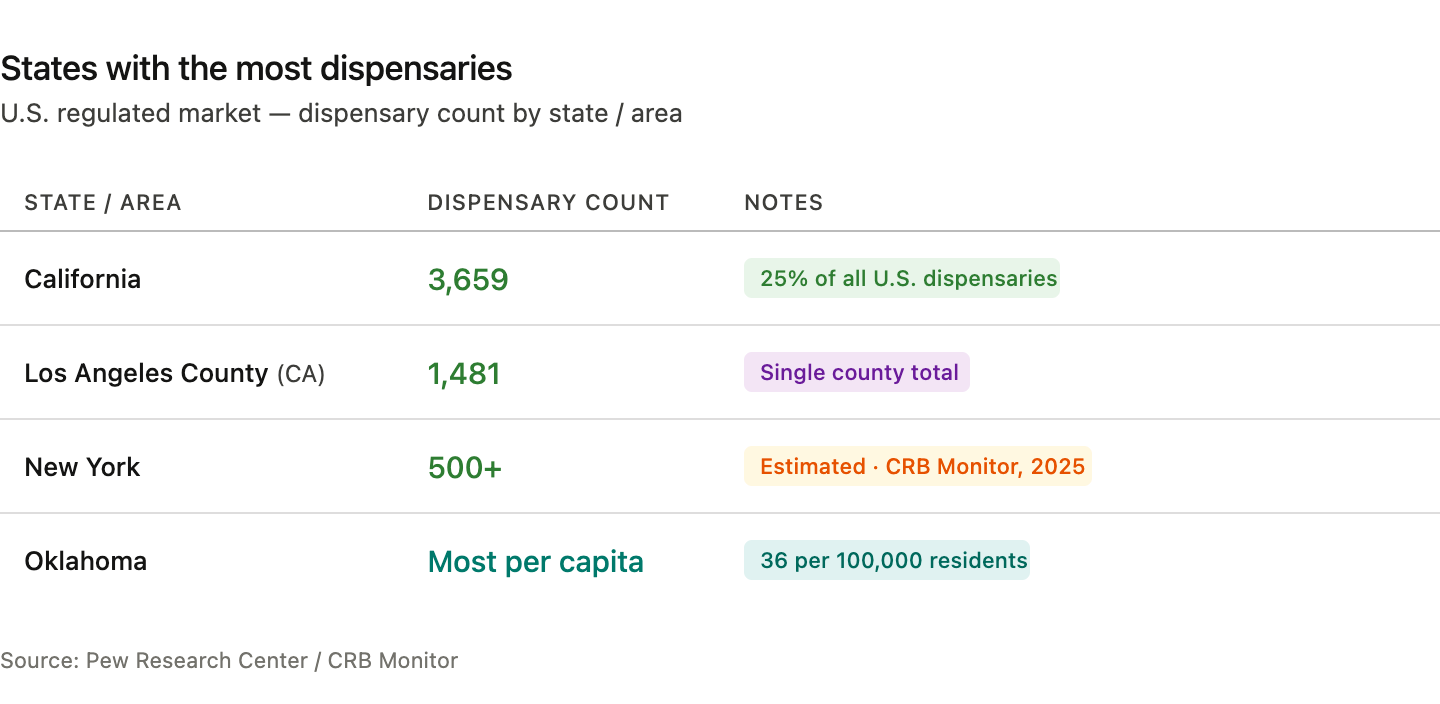
According to Pew Research Center, California's 3,659 dispensaries represent one in four licensed dispensaries in the entire country; with 1,481 cannabis stores, Los Angeles County alone hosts more dispensaries than most states have in total. Oklahoma leads the nation in dispensary density at 36 per 100,000 residents, while New York is quickly growing with 500+ cannabis stores (CRB Monitor).
For operators evaluating expansion into new markets or new locations within existing markets, the ratio of dispensaries to population tells a more useful story than total sales figures alone. A market with strong sales but 50 dispensaries presents a different opportunity than one with the same sales spread across 500 locations. Cova's cannabis analytics and reporting platform gives operators the sales and inventory visibility they need to make those assessments with real data rather than estimates.
Cannabis Product Category Statistics
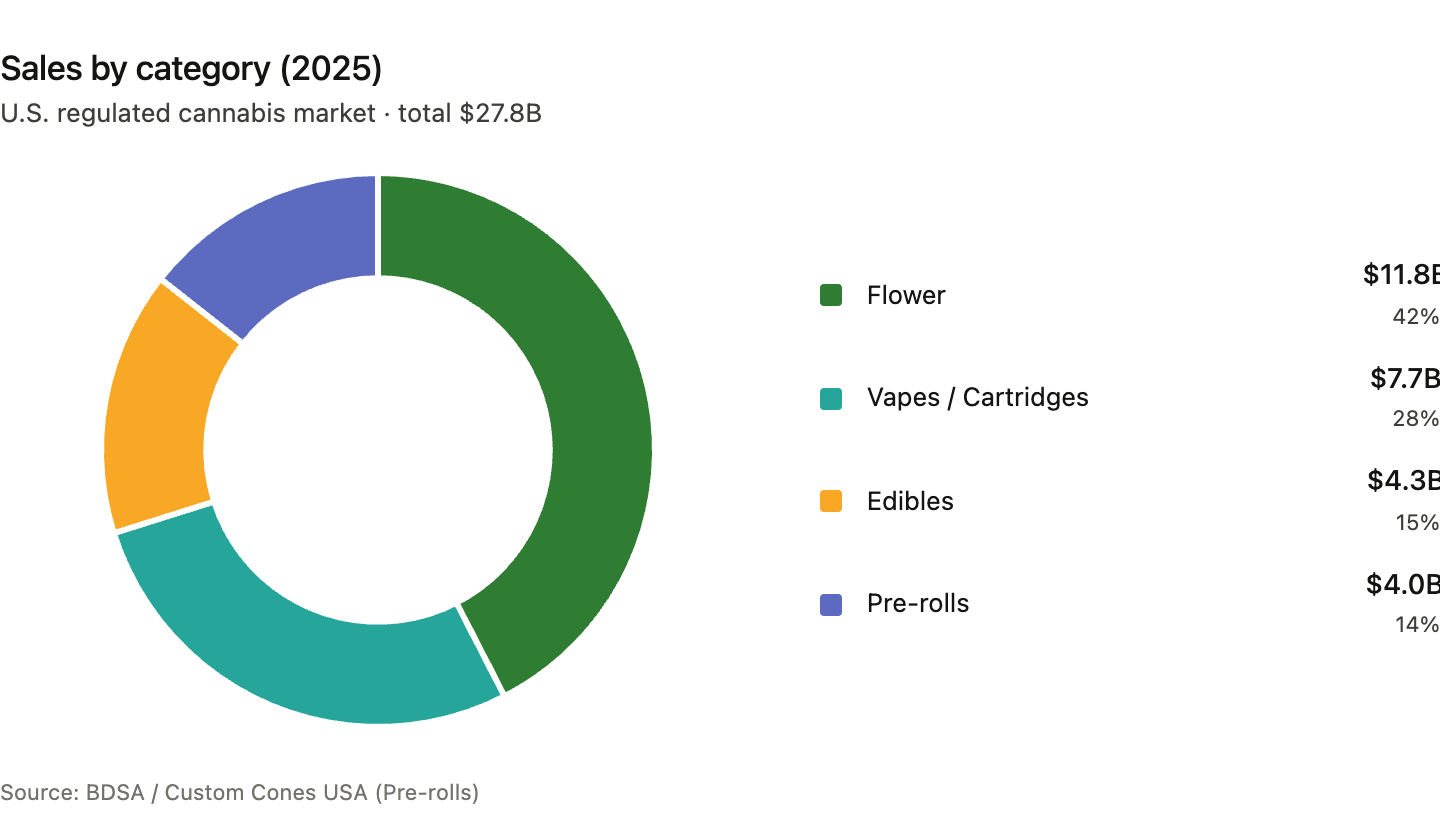
Flower remains the largest product category by dollar volume, but its dominance is shrinking. Pre-rolls have been the industry's growth engine for several consecutive years, while beverages are emerging as the fastest-growing format by percentage. Understanding the product mix shift matters for dispensary buyers, merchandisers, and operators planning their inventory strategy for 2026.
Sales by Category (2025)
|
Category |
2025 Sales |
Source |
|
Flower |
$11.8B |
|
|
Vapes/Cartridges |
$7.7B |
BDSA |
|
Edibles |
$4.3B |
BDSA |
|
Pre-rolls |
$4.0B |
BDSA / Custom Cones USA |
Pre-Rolls: The Industry's Growth Story
Pre-rolls have been the standout category for half a decade. According to cannabis sales data from Headset and Custom Cones USA:
- Pre-roll sales grew 110% from 2021 to 2025, from $1.7 billion to $3.6 billion
- Pre-rolls represented 15.9% of total cannabis sales in Q1 2026
- 394 million pre-roll units were sold in 2024
- Infused pre-rolls — joints containing concentrates, hash, or distillate in addition to flower — now represent 43% of the pre-roll segment by unit
- Infused pre-roll revenue reached $1.68 billion, representing 47% of the pre-roll category revenue
- Multi-pack pre-rolls have grown from 27.7% of the market in 2018 to 50%, reflecting consumer preference for value-oriented formats
In 2025, pre-rolls added $80 million in sales while flower declined $30 million, revealing a category rotation operators should be actively managing.
Beverages: Small but Accelerating
Cannabis beverages remain a small share of total sales but are growing faster than any other category:
- $54.6 million in beverage sales in Q1 2025, up 15% year-over-year (BDSA)
- Beverages represent just 0.9% of total cannabis sales, but growth is concentrated in newer markets
- Michigan: +112% YoY beverage growth (BDSA)
- Ohio: +79% YoY beverage growth (BDSA)
Consumer Product Preferences
- 21% of cannabis consumers prefer THC flower/buds as their primary format (Statista)
- 16% prefer edibles, 15% vapes, and 13% pre-rolls (Statista)
- 42% of consumers prefer edible doses of 10mg or less; the most popular dosage is 2.5–5mg (BDSA)
Dispensary Profitability
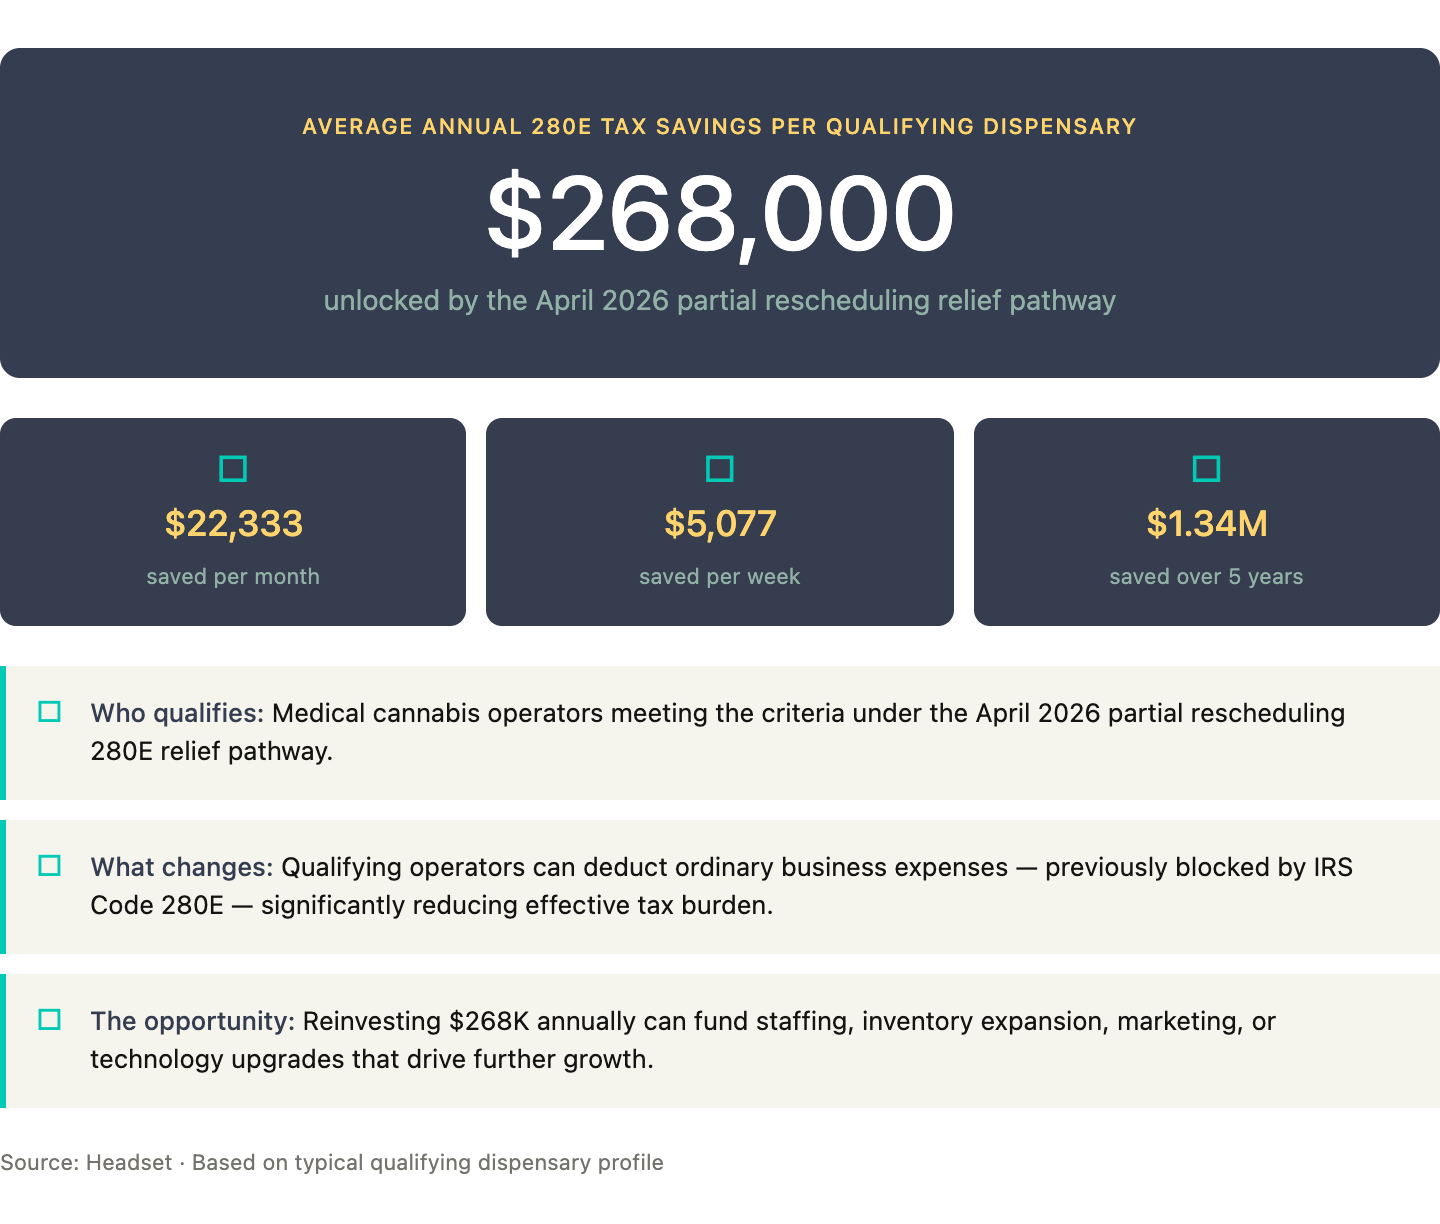
Only 24.4% of U.S. cannabis operators are profitable on an after-tax basis, compared to 65% of all U.S. small businesses (MJBizDaily / Whitney Economics). Gross profit margins typically run 45–55%, and up to 52–60% in limited-license states, but Section 280E of the Internal Revenue Code compresses net margins to 5–12% by prohibiting standard business expense deductions (Northstar Financial). Retail gross profit margins have further compressed from 52.6% in 2021 to 42.7% in 2025 (Headset).
The April 2026 partial rescheduling created a 280E relief pathway for qualifying medical operators. According to Headset, the typical qualifying dispensary would save $268,000 annually; industry-wide relief is estimated at $1.6–$2.2 billion annually. Recreational cannabis remains Schedule I, with a broader rescheduling hearing set for June 29, 2026 (DOJ).
For a full breakdown of dispensary cost structures, earnings benchmarks, and margin drivers, see How Much Money Does a Cannabis Dispensary Owner Make and The True Cost of Opening a Cannabis Dispensary.
Cannabis Tax Revenue
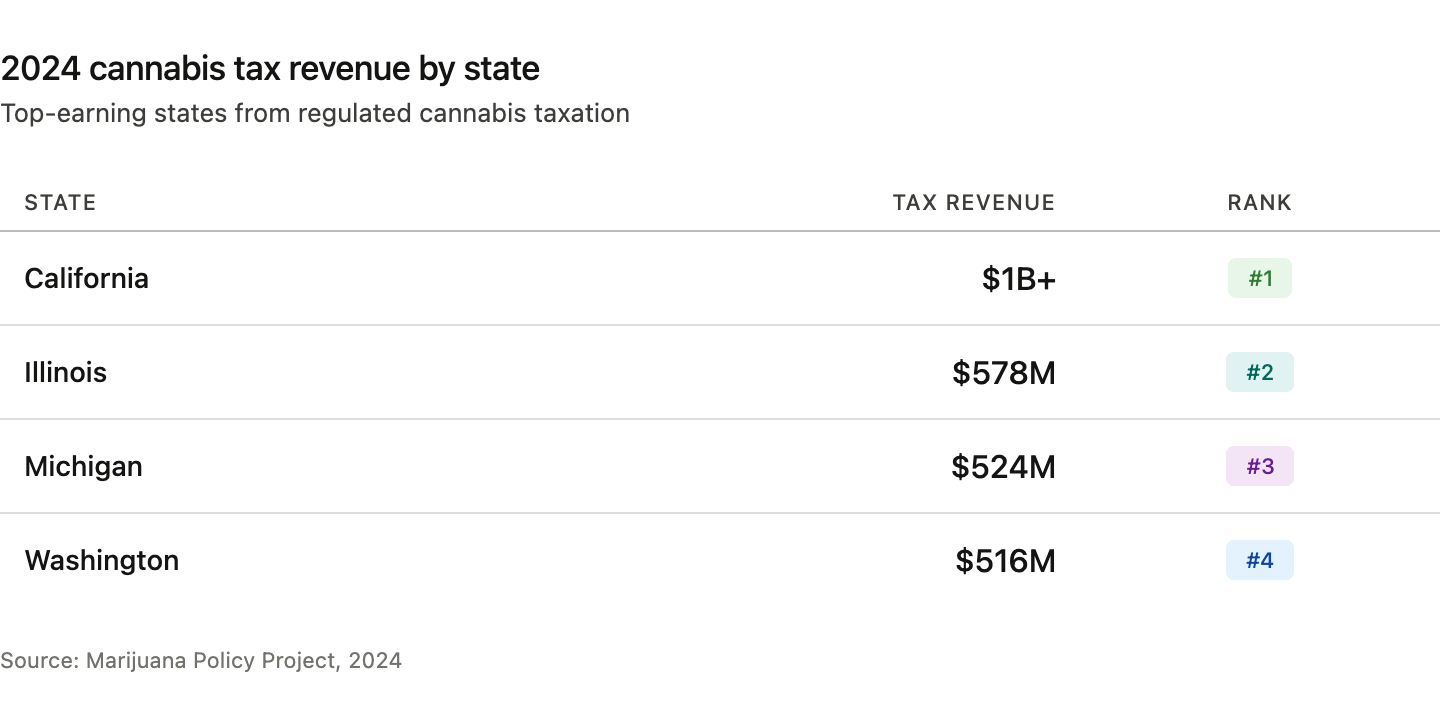
Legal cannabis states have collectively generated nearly $25 billion in adult-use tax revenue since 2014. In 2024 alone, cannabis generated a single-year record of $4.4 billion, according to the Marijuana Policy Project.
2024 Tax Revenue by State
|
State |
2024 Cannabis Tax Revenue |
|
California |
$1B+ |
|
Illinois |
$578M |
|
Michigan |
$524M |
|
Washington |
$516M |
Source: Marijuana Policy Project, 2024
How Cannabis Compares to Alcohol
Despite record-setting cannabis industry growth, cannabis tax revenue still lags well behind alcohol at the national level. The alcohol industry generated $8.93 billion in federal excise tax revenue in 2024 (Statista). The gap reflects the size of the illicit cannabis market — the roughly 75% of consumption that generates no tax revenue — as much as it reflects the relative scale of the two industries.
The cumulative $25 billion in cannabis tax revenue since 2014 is a meaningful figure. It has funded education programs, public health initiatives, and infrastructure in states across the country. It also represents, in a sense, the best possible argument for why legal cannabis operators need to survive: a strangled industry means less tax receipts.
Public Attitudes on Cannabis and Tax Revenue
- 74% of Americans agree that cannabis legalization is a smart way to generate tax revenue (MRI-Simmons, 2025)
- 52% say legalization has been good for local economies (Pew Research, 2025)
Community Reinvestment
Several states are directing cannabis tax proceeds back into communities most affected by prior enforcement:
- New York awarded $5 million to 50 non-profit organizations through its cannabis community reinvestment program (Business of Cannabis, 2025)
- California distributed $52 million through its CalCRG community reinvestment grant program in 2025 (Marijuana Moment, 2025)
For information on how cannabis tax obligations interact with dispensary compliance requirements, see Cova's cannabis dispensary compliance resources.
Cannabis Employment & Salaries
The U.S. cannabis industry supports 425,002 full-time equivalent jobs as of 2025. That’s a 3.4% decline from 440,445 in 2024, according to the Vangst 2025 Cannabis Jobs Report. The state-by-state picture varies sharply, with significant job growth in newer markets and significant losses in established ones.
National Employment Picture
- 425,002 FTE jobs in 2025, down from 440,445 in 2024 (Vangst)
- Projected to reach approximately 800,000 jobs by 2029 (CannabizTeam)
- California leads all states with 74,623 cannabis industry jobs (Vangst)
The industry employed roughly 123,000 people in 2017, growing to 440,445 by 2024 — an explosive increase of more than 300,000 positions in seven years (Leafly / Vangst).
State-by-State Job Growth and Decline (2025)
States with the largest job gains in 2025 were New York (+209%), Mississippi (+103%), and Ohio (+34%). States that saw the largest declines were Arizona (-52%) and Illinois (-25%) (Vangst 2025 Cannabis Jobs Report).
Salary Trends
- Budtender median salary: $36,600 in 2025, down 4.69% from approximately $42,000 in prior years (CannabizTeam)
- Salaries declined 4–7% across most cannabis job categories in 2025 (CannabizTeam)
Salary compression is a predictable consequence of profit margin pressure. When net margins run 5–12% and gross margins are declining, labor costs — typically the largest controllable expense line — absorb the adjustment. Operators using Cova's reporting and analytics platform can track labor efficiency metrics alongside sales-per-hour and transaction volume data to make staffing decisions based on actual performance rather than guesswork.
Cannabis Legalization & Public Support
As of January 2026, 24 states plus Washington, D.C. have legalized adult-use cannabis, and 40 states plus D.C. allow some form of medical use (NCSL). Public support for legalization in some form stands at 87%, according to Pew Research Center's 2025 survey — a figure that would have been unimaginable when Gallup first asked the question in 1969 and recorded 12% support.
For a full map of current legal status by state and territory, see Where Is Cannabis Legal in North America in 2026.
Legalization Status (NCSL, 2026)
- Adult-use legal: 24 states + DC + 3 territories
- Medical use legal: 40 states + DC + 3 territories
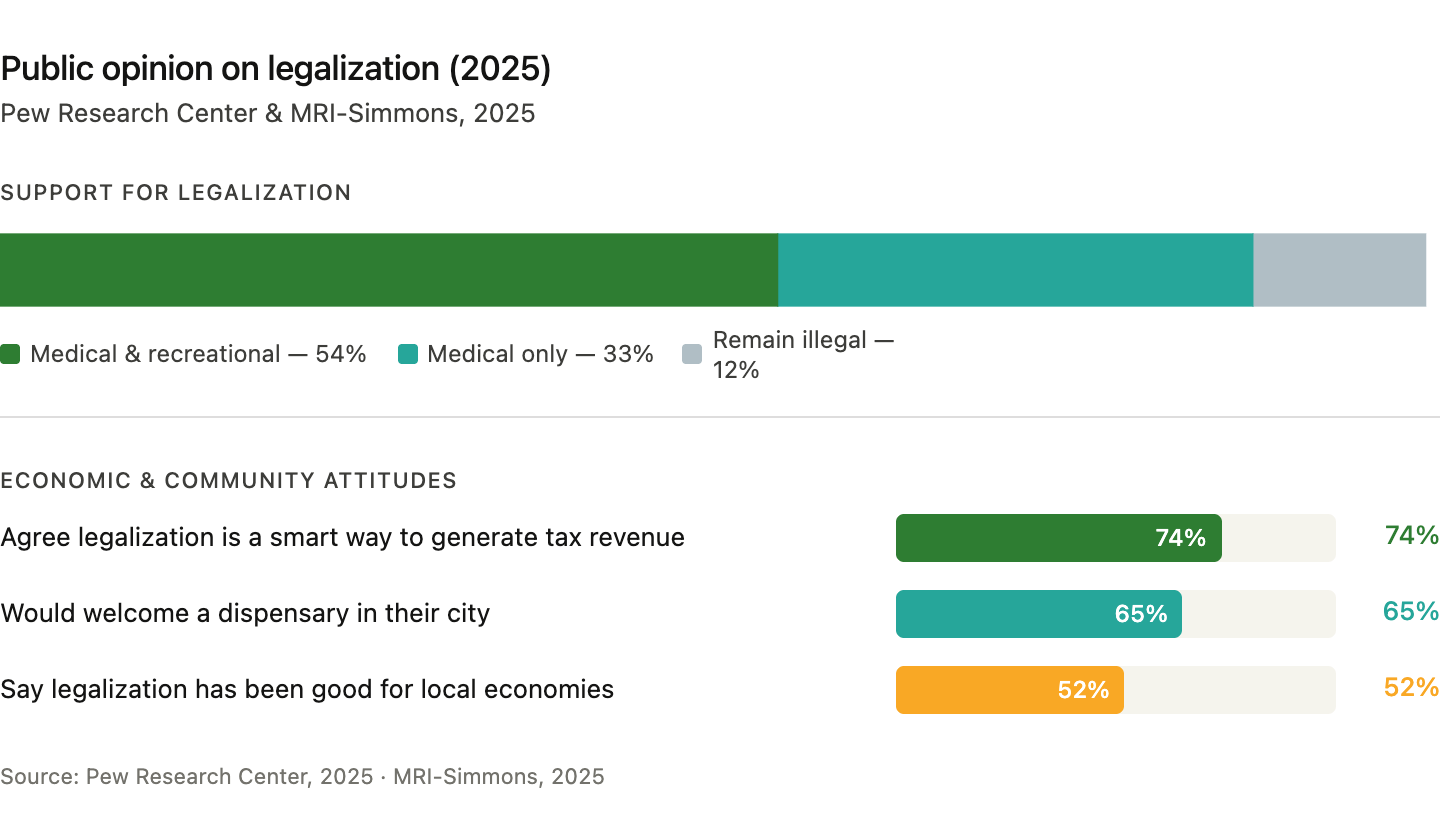
Public Opinion on Legalization (Pew Research, 2025)
- 87% support legalization in some form
- 54% support both medical and recreational legalization (down from 57% in prior surveys)
- 33% support medical use only
- 12% believe cannabis should remain entirely illegal
- 52% say legalization has been good for local economies
- 65% say they would welcome a dispensary in their city (MRI-Simmons, 2025)
- 74% agree legalization is a smart way to generate tax revenue (MRI-Simmons, 2025)
Federal Regulatory Timeline (2025–2026)
|
Date |
Development |
|
November 12, 2025 |
Federal spending package enacted with new hemp-derived THC restrictions: 0.4 mg total THC per finished package, effective November 12, 2026 |
|
December 18, 2025 |
White House executive order on cannabis and CBD research signed |
|
April 23, 2026 |
DOJ/DEA immediately place FDA-approved cannabis products and qualifying state-licensed medical marijuana in Schedule III |
|
June 29, 2026 |
Broader marijuana rescheduling hearing begins — recreational cannabis remains Schedule I pending outcome |
|
November 12, 2026 |
Hemp 0.4 mg total THC/package rule takes effect; nearly every intoxicating hemp product currently sold at retail affected |
The hemp restriction deserves particular attention from dispensary operators. The November 2025 legislation redefined "total THC" to include all THC isomers, not just delta-9, effectively banning delta-8, delta-10, HHC, THCP, and other synthetic cannabinoids currently sold through gas stations, smoke shops, and online retailers with no license requirements, no testing mandates, and no age verification obligations. When the 0.4 mg per-package limit takes effect on November 12, 2026, the competitive dynamic shifts meaningfully in favor of licensed dispensaries.
How meaningful that shift turns out to be depends heavily on enforcement. The unlicensed hemp-derived THC market has operated largely without federal interference since the 2018 Farm Bill created the regulatory gap these products exploited. Whether the DEA and state agencies prioritize enforcement against non-compliant hemp retailers in the months following the effective date remains to be seen. What is certain is that the legal basis for those products disappears in November 2026 — and licensed dispensaries that have invested in compliance, product testing, and responsible retail will be on the right side of that line.
Cannabis Arrests Persist Despite Legalization Progress
- More than 200,000 marijuana-related arrests were made in 2024 (NORML)
- 92% were for simple possession only (NORML)
- The DEA seized more than 5 million plants in 2024 (DEA via NORML)
The persistence of marijuana arrests — at 200,000+ per year, even as two-thirds of states have legalized in some form — underscores why federal rescheduling matters beyond just 280E tax relief. Social equity in licensing and expungement programs remain active policy debates in states from New York to California.
Global Cannabis Market & Medical Use
The global legal cannabis market reached approximately $43.7 billion in 2025 using a narrow definition (BDSA), with North America accounting for up to 84% of worldwide revenue. Broader estimates that include hemp, CBD, and adjacent product categories place the global total as high as $102.72 billion (Fortune Business Insights). As with U.S. figures, methodology differences explain the variation — and the distinction matters when evaluating global market opportunities.
Global Market Overview
- North America: 73–84% of the global legal cannabis market (BDSA / Fortune Business Insights)
- European legal cannabis sales: approximately €1.5 billion in 2025, nearly triple 2023 levels (Prohibition Partners)
- European market forecast: €2.5 billion by 2027 (Prohibition Partners)
- Approximately 50 countries have some form of legal cannabis framework
2025–2026 International Developments
|
Country |
Development |
|
Czech Republic |
Adult-use legalization effective January 1, 2026: home cultivation of up to 3 plants, possession of up to 100g permitted |
|
Thailand |
Reclassified cannabis flowers as a "controlled herb" requiring prescription (June 2025) |
|
Ukraine |
Official rollout of medical cannabis program began in early 2025 |
Europe's growth trajectory is notable context for operators evaluating international positioning. The near-tripling of European sales in two years mirrors early-stage growth patterns seen in U.S. state markets during their first years of regulated operation.
Why Consumers Use Cannabis
Consumer motivations for cannabis use extend well beyond recreational enjoyment. According to New Frontier Data's 2025 consumer research:
- 64% of consumers use cannabis for relaxation
- 59% for stress relief
- 52% for anxiety management
- 48% for pain relief
- 45% for sleep support
Cannabis vs. Prescription Alternatives
- 16% of Americans now use cannabis as a sleep aid — more than those using prescription sleep medications (12%) or alcohol (11%) for the same purpose (NuggMD, 2025)
- More than 50% of medical cannabis patients report substituting cannabis for at least one prescription drug (New Frontier Data)
- 62% choose cannabis over alcohol when given the choice (New Frontier Data)
Medical Use and Veterans
- 91% of veterans using medical cannabis reported improved quality of life in a study published in Clinical Therapeutics
- The December 2025 White House executive order on cannabis and CBD research signals growing federal openness to medical applications
For a deeper analysis of consumer behavior trends and the product categories capturing medical and wellness-oriented spending, see our articles on cannabis industry trends for 2026 and the most popular cannabis products every dispensary should stock. For CBD-specific legal status information, see our article titled Where Is CBD Legal in North America.
What the Numbers Actually Mean for Your Dispensary
The cannabis industry in 2026 is a study in contradictions. More Americans are using cannabis than ever before, states are collecting record tax revenue, public support for legalization is at an all-time high — and yet fewer than one in four licensed operators is actually turning a profit, 75% of consumption still runs through the illicit market, and thousands of businesses have surrendered their licenses in the past 18 months.
This isn't a struggling industry; it's a complicated one. That’s an important distinction for dispensary owners. The growth era rewarded boldness: open locations, stack SKUs, capture market share. The current era rewards something less glamorous — knowing your numbers cold, running lean, and making sure your technology is actually working for you instead of against you.
The operators who end up in that profitable 24.4% won't necessarily be the ones with the best real estate or the biggest ad spend. They'll be the ones who caught the margin compression early, responded faster than their competitors, and built operations that could survive a down year without hemorrhaging cash.
That's exactly what Cova's cannabis POS platform, compliance tools, and reporting and analytics suite are built for. If you want to see what that looks like in practice, book a demo or talk to a Cova specialist today.