.jpg?width=1200&name=FEATURED-IMG---1200-x-627%20(1).jpg)
Operating a successful cannabis retail business with sustainable growth is almost impossible without leveraging in-depth dispensary data analytics. Cova Software infuses AI technology to deliver comprehensive and advanced reports that let cannabis retailers gain actionable insights, track real-time dispensary performance, and make quick AI-powered decisions. Below are four critical questions important to every cannabis retailer that Cova’s advanced cannabis analytics data reporting can answer in just one click.
What Does my Cannabis Store’s Traffic look like, During the Day/Week/Year?
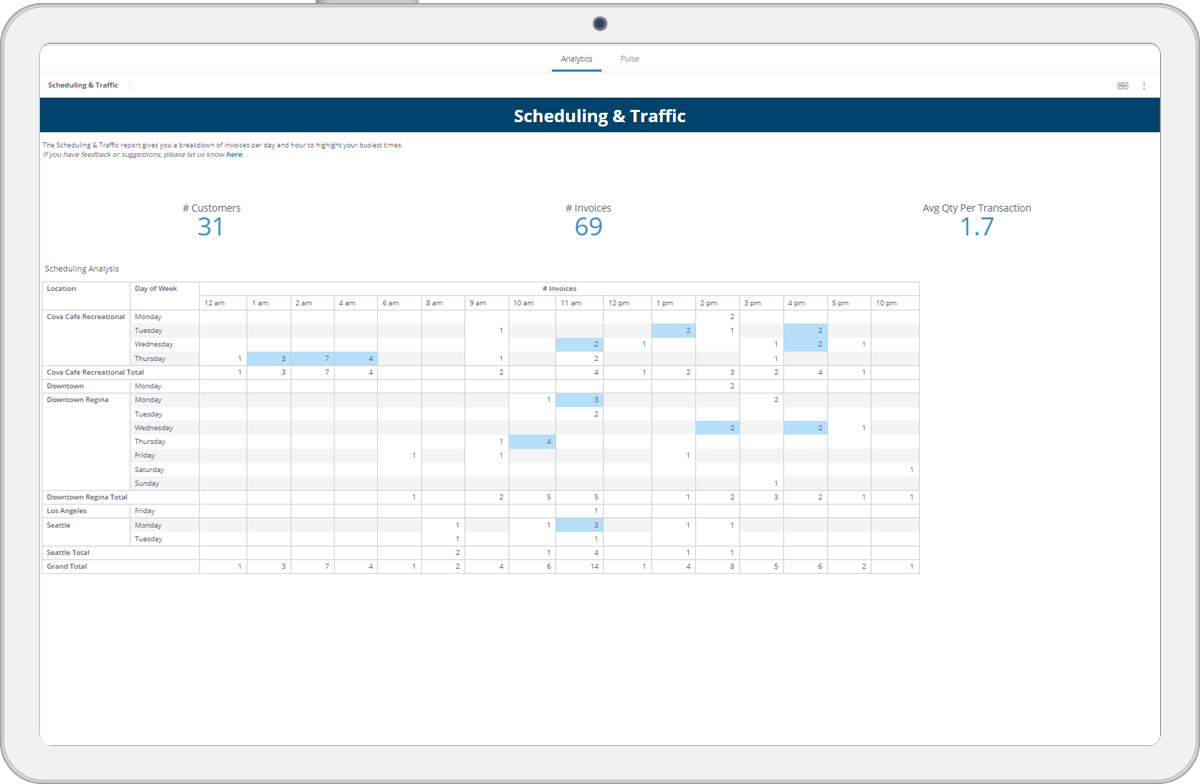
Understanding dispensary traffic patterns let you plan and efficiently manage your cannabis retail staff and inventory. Find out what time of day and what day of the week your store(s) get busy, and schedule the optimal number of employees to seamlessly serve customers without delay. On the other hand, knowing when to expect lower traffic helps you spend less on payroll and allow your employees to take some time off.
Cova’s “Scheduling & Traffic” dashboard gives you a breakdown of invoices per day of the week and hour to highlight your busiest times.
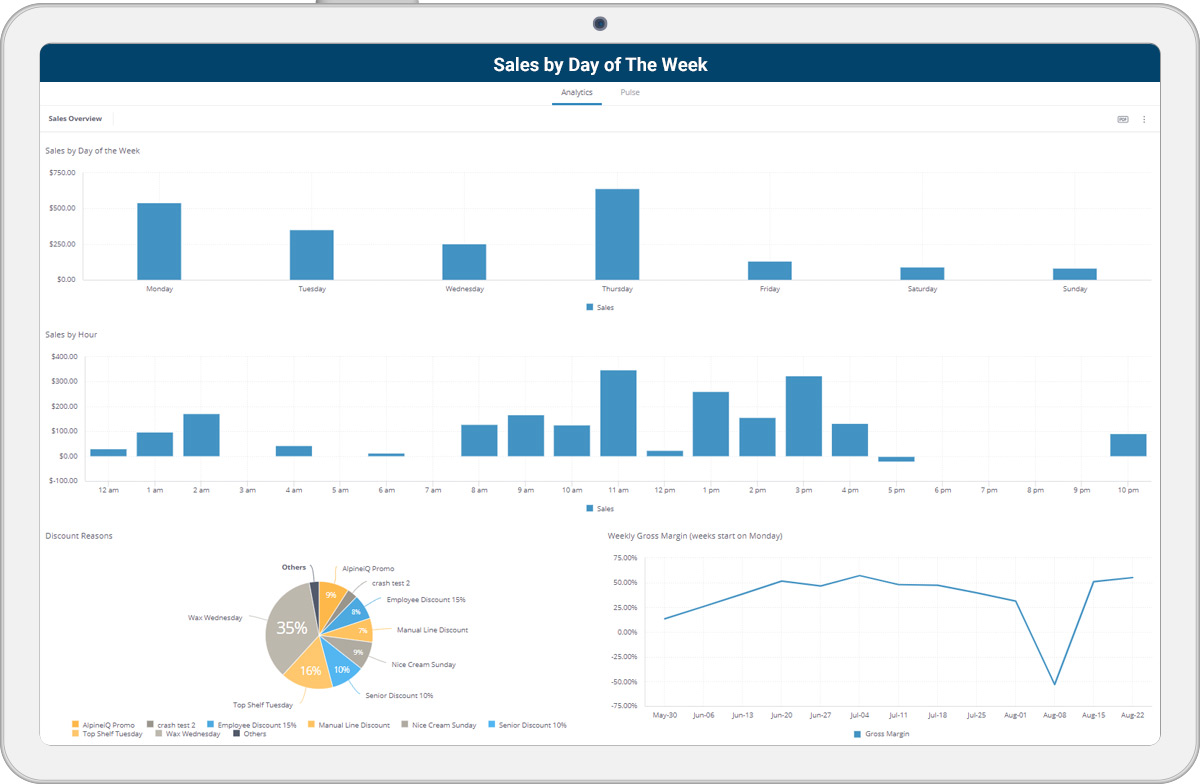
You can also track your sales amount per day and hour at a glance via the “Sales by Day of the Week” and “Sales by Hour” charts. Multi-store cannabis retailers can filter reports by location to delve into each of their dispensary locations' data and track them throughout different time ranges using the “Date” filter.
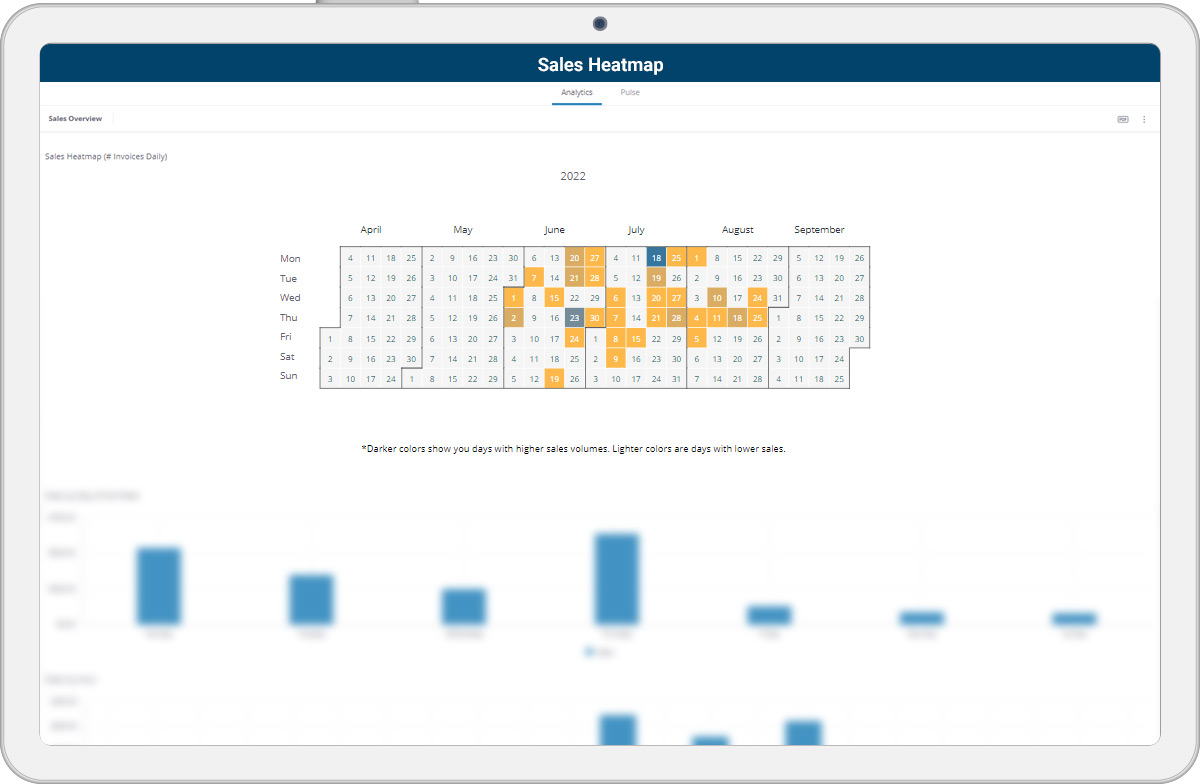
“Sales Heatmap” is a calendar view displaying a quick visual of the busiest day of the year. This heatmap can help you recognize how holidays, promotional campaigns, seasonal tourism, new hires, and competitor activities may impact your sales. Pinpoint holidays and high-demand periods that drive traffic and orders to your dispensary(s) and optimize dispensary operations accordingly.
How are Different Cannabis Products, Brands, and Categories Performing?
One of the determining business intelligence insights for any cannabis retailer is how profitable different brands, categories, and products are, what ROI they have, and how customers purchase them. Identifying high-margin cannabis products that boost your profit is as important as identifying top-selling ones that drive more customers to your store(s). This cannabis data just not allow you to optimize your dispensary inventory but also helps you launch targeted marketing campaigns. Such dispensary analytics combined with market data will help you stay one step ahead of the competition.
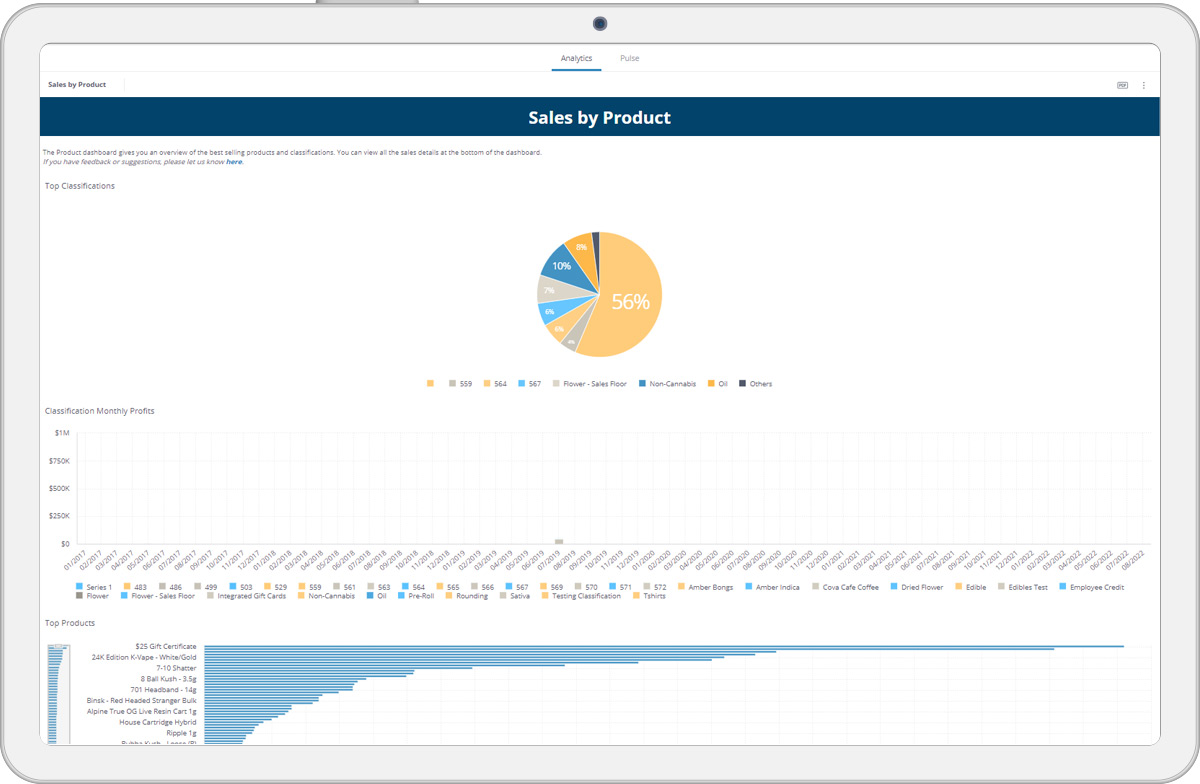
Cova’s “Sales by Product” dashboard offers an overview of best-selling cannabis products, categories, and brands that you should re-order and keep in stock. You can easily review classifications’ monthly profits and spot the most refunded products that you may decide to curtail or stop ordering in the future. Analyzing the “Discount Detailed” report allows you to understand what products sell faster with discounts and spot those that may negatively impact your cannabis business margins. In the “Product Details” report, you can get granular and sort products by gross profit, gross margin, discount, and more for further data analysis.
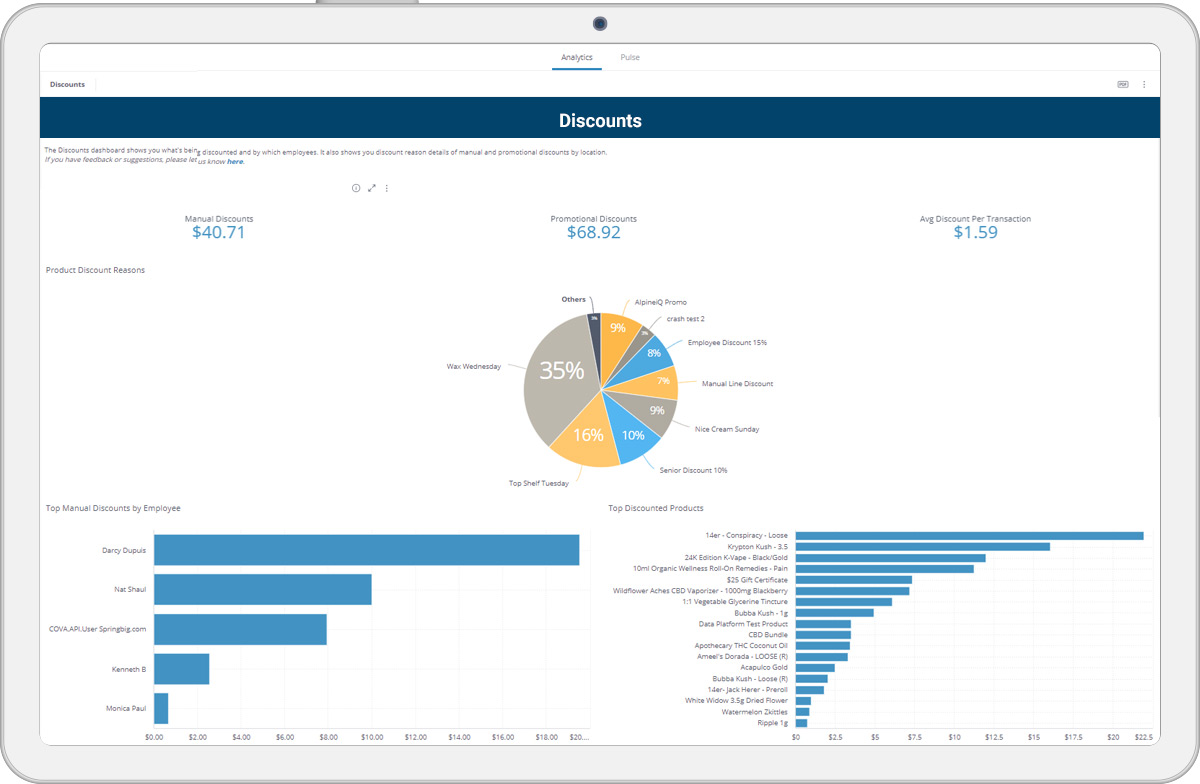
How do Promotions and Discounts Perform?
Discounts and promotions are great incentives to encourage customers to buy more, optimize your cannabis inventory and boost your retail sales. As a store manager, you must have insights into how discounts and promotions are performing and impacting your sales and margin.
With Cova’s “Discount” dashboard, find out what discounts have been frequently used, for which products, by which employees, and in which location. You may decide to lower the pricing for top-discounted products or bundle them with other cannabis products to increase the transaction value.
In this AI-driven dashboard, you can also find out what cannabis promotions drove higher sales and how profitable they were for your store. You may want to have a conversation with those employees who issued the highest amount of manual discounts. This will allow you to learn why and determine whether it’s a sustainable and profitable strategy for your dispensary.
How is my Dispensary Business Performing?
As a cannabis retail store manager, you need to frequently review your daily, weekly, and monthly sales and compare how your store is performing based on historical sales. Tracking your dispensary’s sales data allows you to get alerted when your location is underperforming and track sales trends over weeks and months. It’s prudent to probe into any reason(s) for a staggering change and determine whether internal or external things contribute to it.
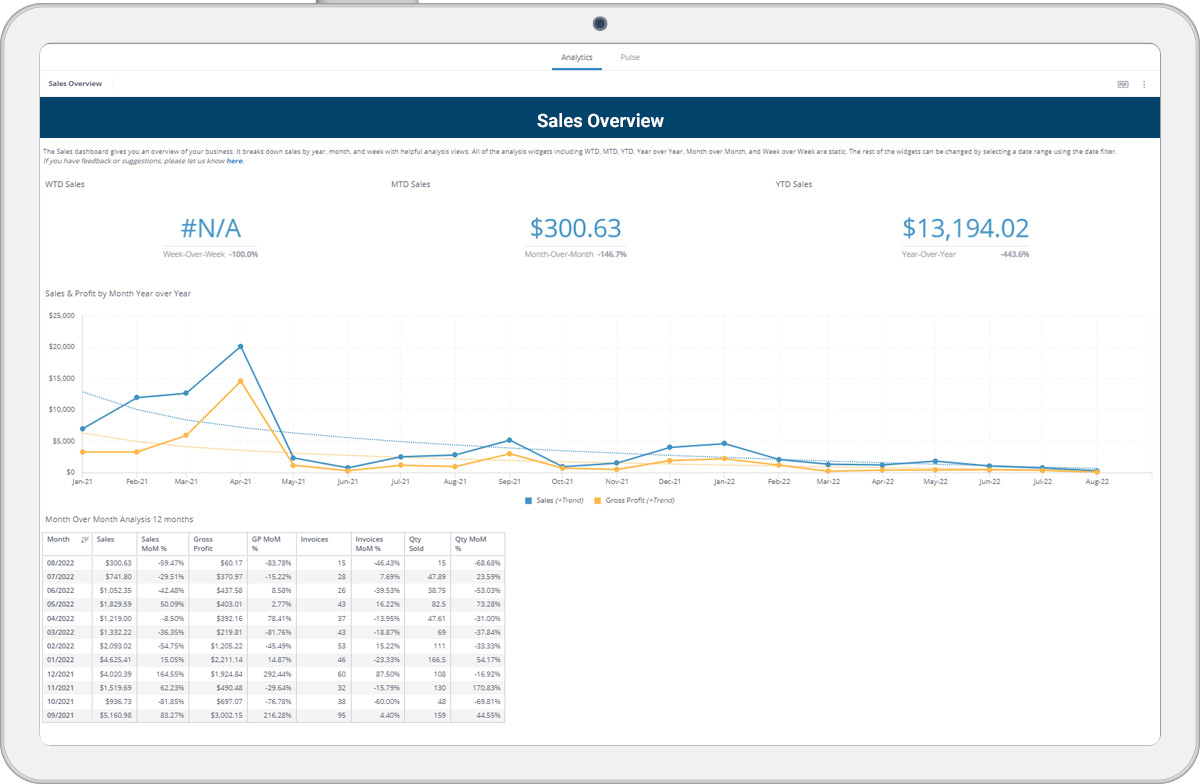
In Cova’s “Sales Overview” dashboard, you can stay on top of your cannabis sales data and quickly check your week-to-date, month-to-date, and year-to-date sales, and how your business is meeting its sales goals. “Sales and Profit by Month - YOY” helps you track your monthly sales vs. profit throughout the year and compare it with the previous year. This could help you stay informed about any successful dispensary opening/closing campaigns if you spot and investigate a significant change. In “Sales Details”, get a granular view of your sales data, total invoices, total margin, total discounts, and more consumer insights.
The legal cannabis industry has come a long way. As adult-use cannabis goes mainstream, cannabis retailers must make the best use of cannabis data analytics to grow sustainably. With Cova Software as your partner, such insights will always be available at your fingertips instantly. If you’re not already a Cova-powered dispensary, click below to learn more about how we can help you stay ahead of the competition.